Analyzing AWS Lambda logs produced with Lamba Powertools using CloudWatch Logs Insights


Table of contents
- What is CloudWatch Log Insights?
- What improvements does AWS Lambda Powertools Logger provide for log analysis?
- How to get started using CloudWatch Log Insights?
- Sample Queries
- View logs with AWS Lambda Powertools Logger provided fields as columns
- View logs with AWS Lambda Powertools Logger (with injected Lambda context) provided fields as columns
- Filter logs with a substring in the message field
- Filter logs of specified severity levels
- Show the number of log events for each severity level
- Show the number of logs of a specified severity level, grouped into time intervals
- Filter logs by a specified service across multiple Lambda functions
- Filter logs of the Lambda invoke event
- Filter logs with message object fields
- Save your queries
- Conclusion
In a previous post (here), I covered using AWS Lambda Powertools to improve the quality of your Lambda function logs. In this post, we will take advantage of those logging improvements to perform log analysis using CloudWatch Log Insights.
What is CloudWatch Log Insights?
CloudWatch Log Insights is a part of the CloudWatch Log service. It provides more powerful query capabilities compared to the search using filter patterns available in your Log Groups. In addition, it allows you to query multiple log groups across a specifiable date-time range.
These features will be incredibly useful when analyzing your AWS Lambda logs to troubleshoot faults and investigate anomalies. Furthermore, as its name suggests, you can use CloudWatch Log Insights to analyze your logs and gain insights into the services provided by your AWS Lambda functions
CloudWatch Log Insights has its own query language which may take some effort to learn to use effectively. However, to save you this trouble, I've gathered a selection of queries with examples that you can use to analyze your AWS Lambda function logs that have been produced with the AWS Lambda Powertools Logger.
What improvements does AWS Lambda Powertools Logger provide for log analysis?
Lambda Powertools Logger has two key features that I would like to highlight which improve the ability to perform log analysis. They are:
JSON format
Common standard fields
The Lambda Powertools Logger will output your logs in JSON format which is machine parsable by many log analysis tools including CloudWatch Log Insights. With JSON format you provide a key-value structure to your logs. You can then define fields that can be queried and filtered, allowing more convenient searches of desired information from your logs.
The Lambda Powertools Logger also provides you with common standard fields which will be present in every log message. These fields include:
level- Log severity levellocation- Location in the code where the logged message was producedservice- A service name that you can optionally providemessage- The log message
These fields can be used in CloudWatch Log Insight queries. Below is an example Lambda function log entry produced using the AWS Lambda Powertools Logger:
{
    "level": "INFO",
    "location": "lambda_handler:12",
    "message": "Doing work",
    "timestamp": "2023-07-31 06:10:20,459+0000",
    "service": "logging-demo",
    "xray_trace_id": "1-64c7504c-14ded77379dc1d4246cd3973"
}
How to get started using CloudWatch Log Insights?
CloudWatch Log Insights can be accessed from the AWS CloudWatch Console (https://console.aws.amazon.com/cloudwatch/home). On the left-hand side under Logs choose Log Insights.
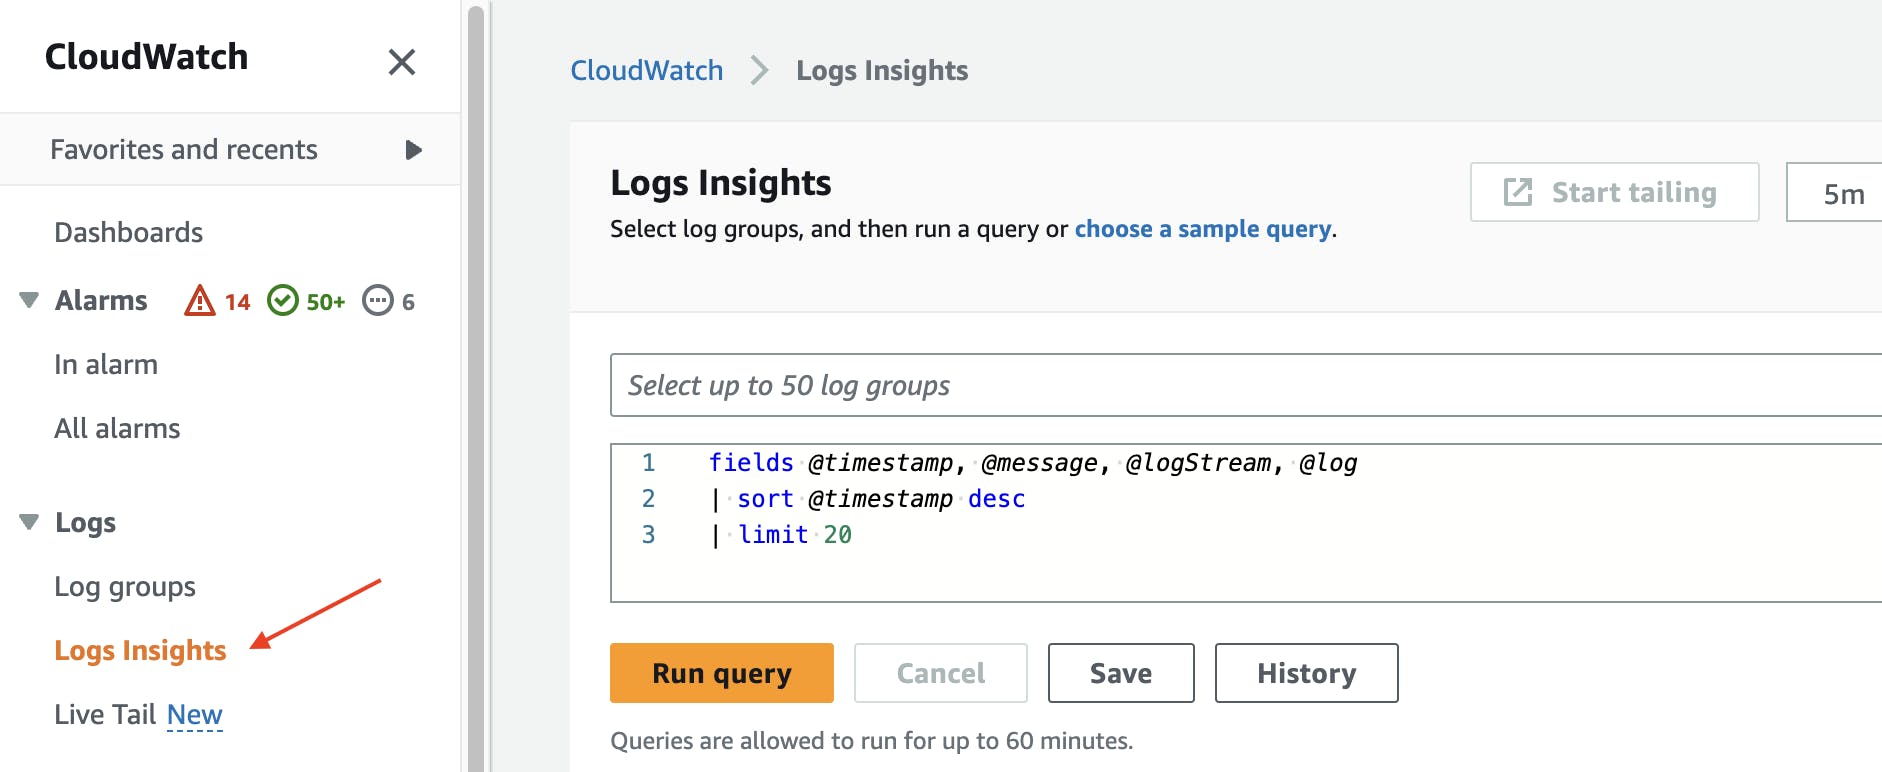
You will find a query already prepopulated that can be used for any CloudWatch log group to return 20 of the last logs events.
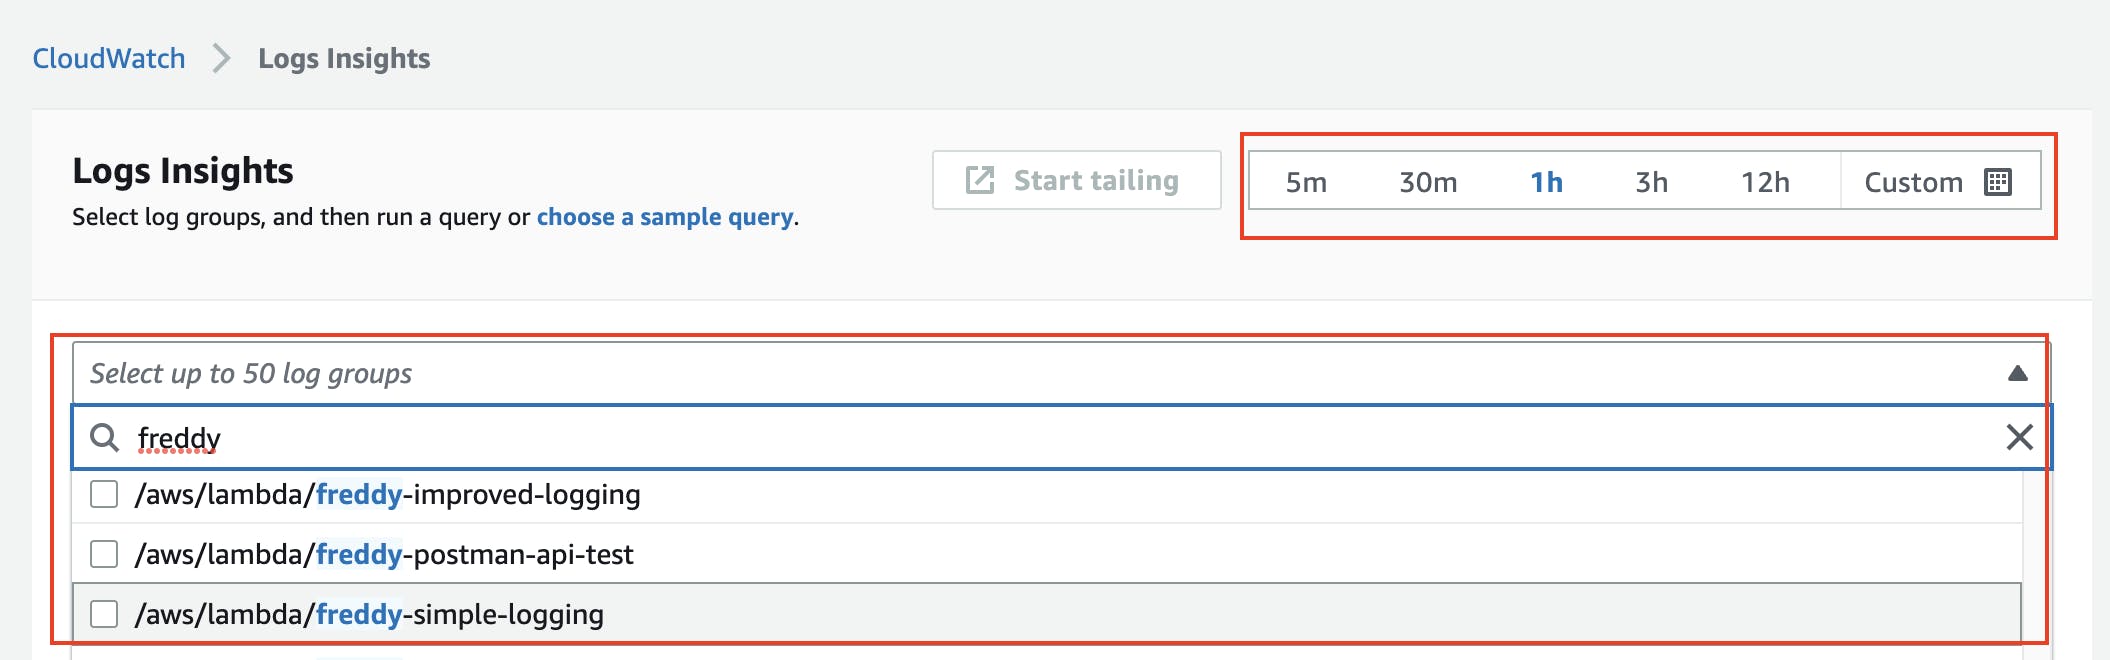
In the search box, you can add up to 50 log groups to query. You can also select an absolute or relative date-time range to query.
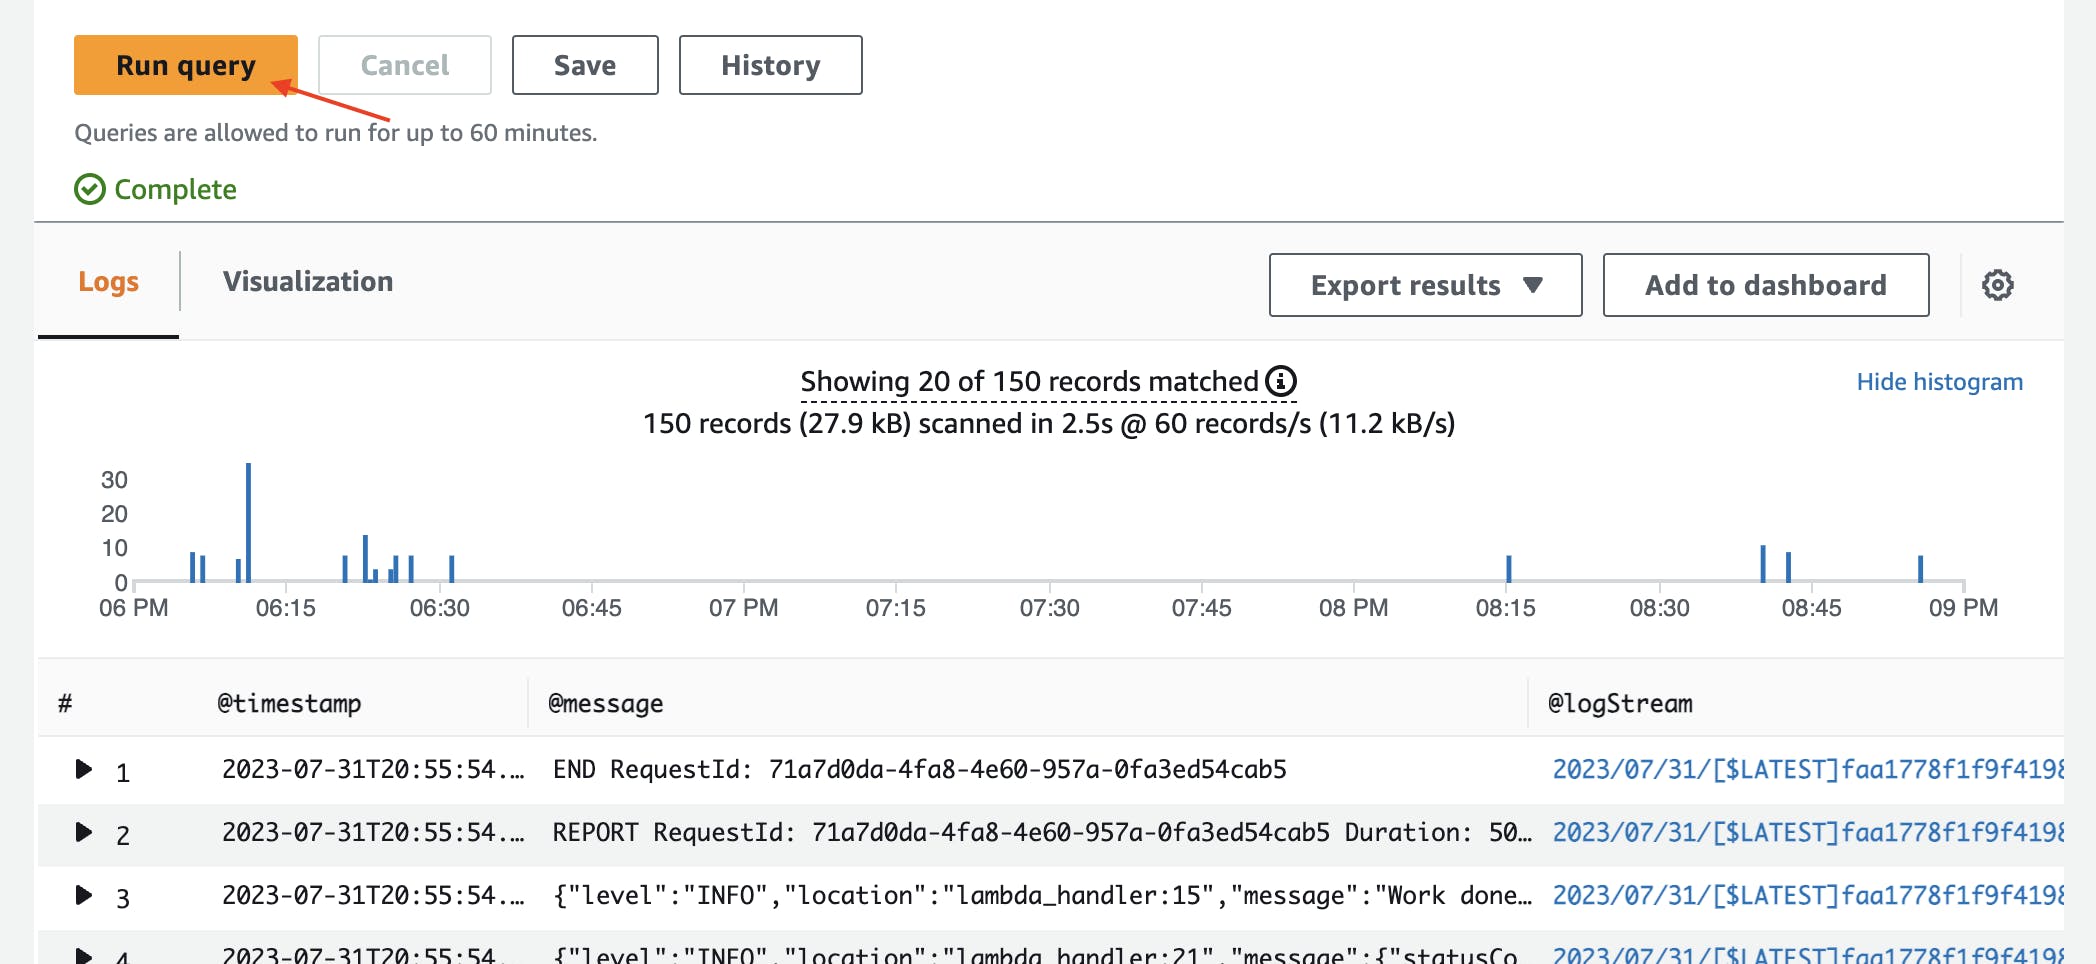
Click Run query to run the current query. The results of the query are displayed in a table with columns specified by your query. A histogram is also shown with the quantity of matched records against time.
CloudWatch Log Insights charges you based on the amount of data queried. CloudWatch Log Insights queries your log data that has been stored in CloudWatch Logs. CloudWatch Logs charges you based on the amount of data collected and the amount of data stored. AWS Cloudwatch pricing is available at: https://aws.amazon.com/cloudwatch/pricing/
Sample Queries
The sample CloudWatch Log Insight queries provided below are intended to work with Lambda function logs using AWS Lambda Powertools Logger (the topic of this blog post). They are not expected to work with Lambda functions logs that do not use Lambda Powertools Logger (unless your logging approach mimics AWS Lambda Powertools Logger).
If you want to try some of the sample queries yourself in CloudWatch Log Insights, you can find some sample Lambda function code to generate log messages in my previous blog post here.
View logs with AWS Lambda Powertools Logger provided fields as columns
The below query will show logs with all the common standard fields provided by the AWS Lambda Powertools Logger as columns.
display @timestamp, timestamp, service, level, xray_trace_id, location, message, @message
| sort timestamp desc
An example query result is shown below:
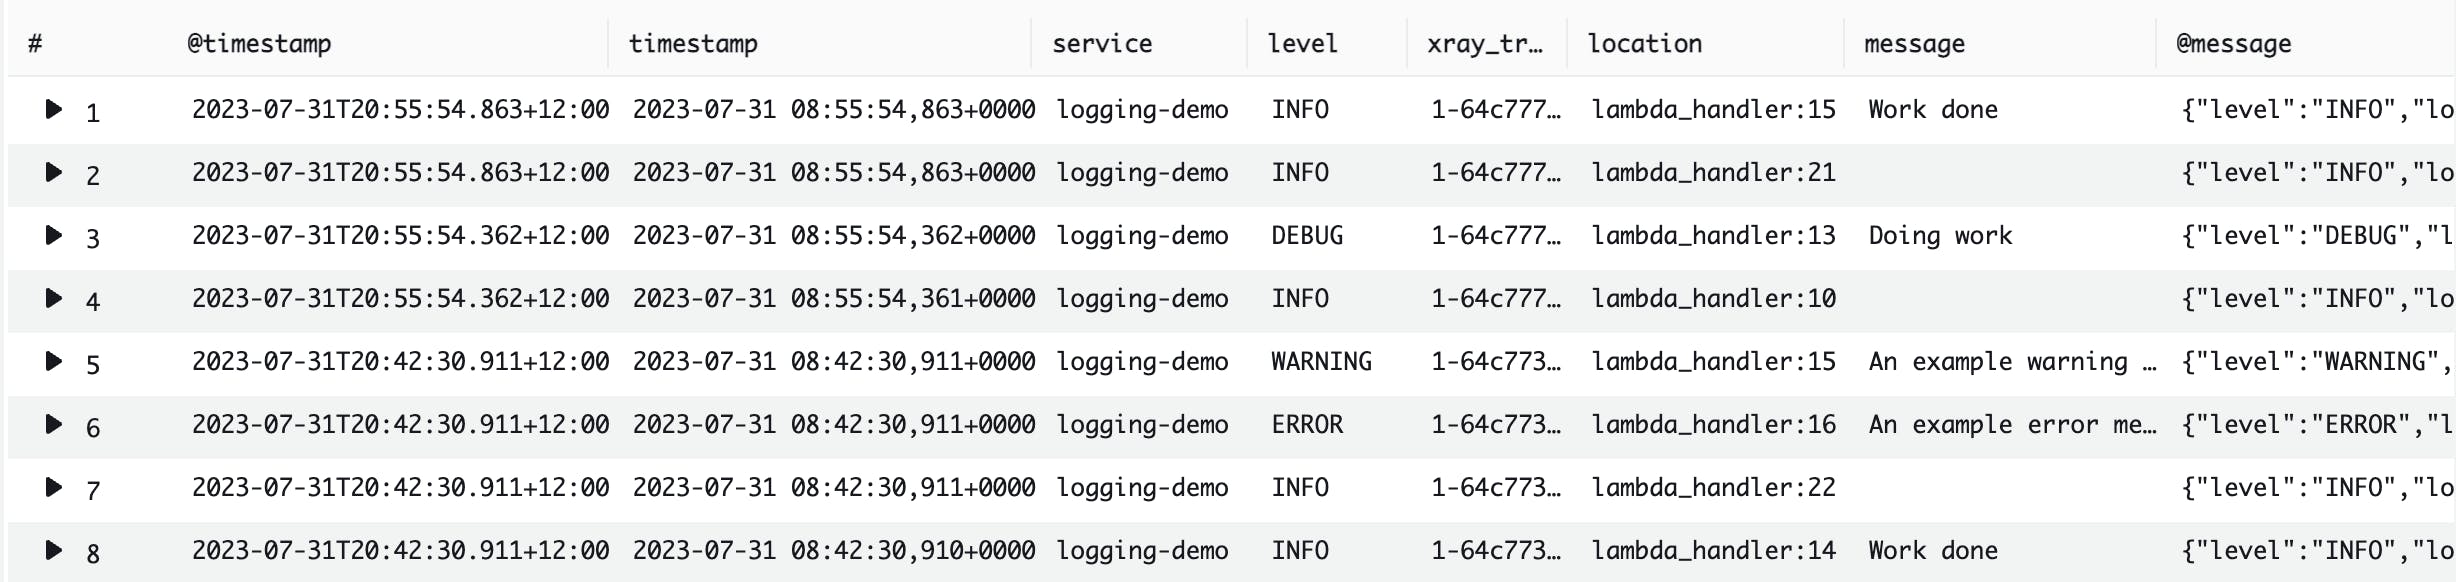
The differences between @timestamp and timestamp column fields are:
@timestampis a CloudWatch Log Insights generated field which is the the timestamp of CloudWatch Log event submitted using the InputLogEvent API call. The AWS CloudWatch Log Console front end can display this timestamp in your local timezone as configured in the data range selector (UTC+12:00 for this example).timestampis the timestamp generated by the AWS Lambda Powertools Logger at the occurrence of log event execution. This uses a timezone configurable in the Lambda functions code.
The difference between @message and message is:
@messageis a CloudWatch Log Insights generated field and is the raw unparsed log event.messageis the message field from the AWS Lambda Powertools Logger. This is the message argument passed to the AWS Lambda Powertools Logger instance method. If this field is not a flat object value, then it is not shown in the table cell.
View logs with AWS Lambda Powertools Logger (with injected Lambda context) provided fields as columns
The AWS Lambda Powertools Logger can capture Lambda context info by providing the following decorator above the Lambda handler function.
@logger.inject_lambda_context
def lambda_handler(event, context):
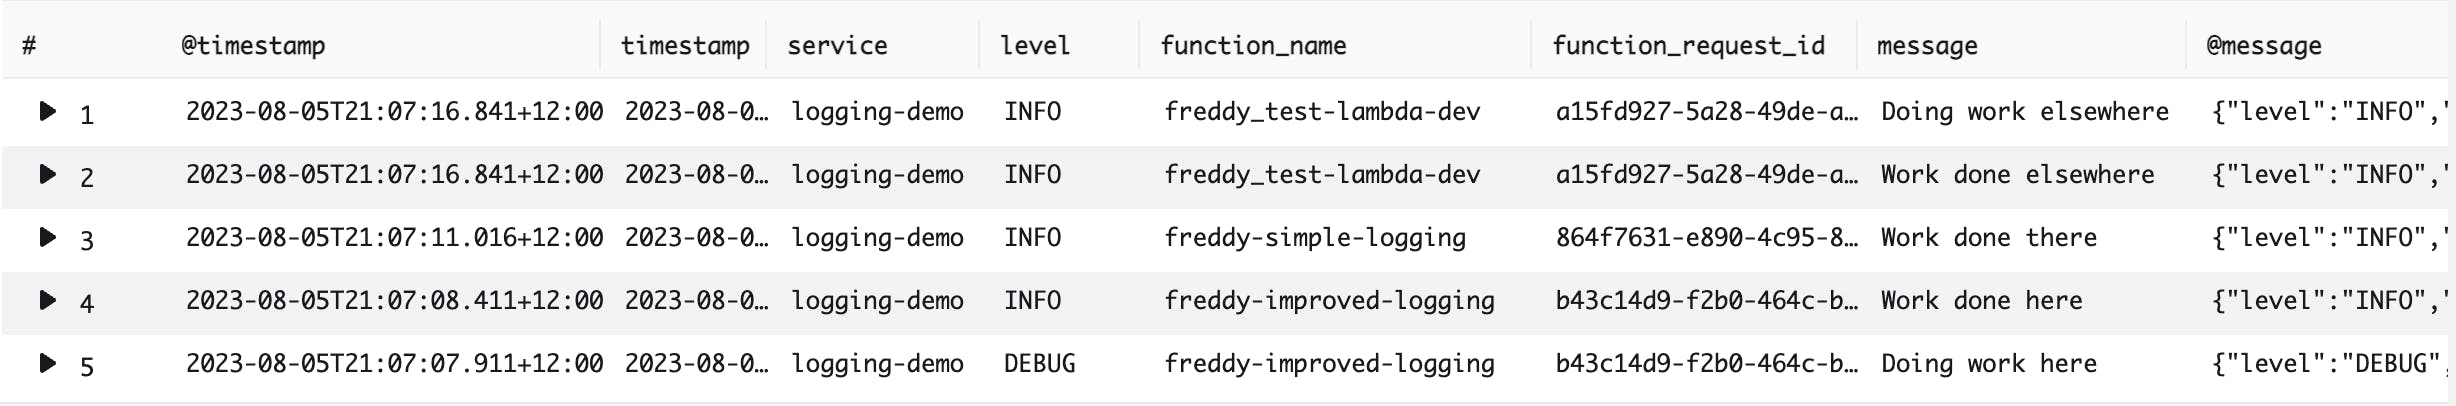
This then provides additional common standard fields for use as columns some of which are shown in the query below:
display timestamp, service, function_name, level, function_request_id, message, @message
| sort timestamp desc
An example query result is shown below:
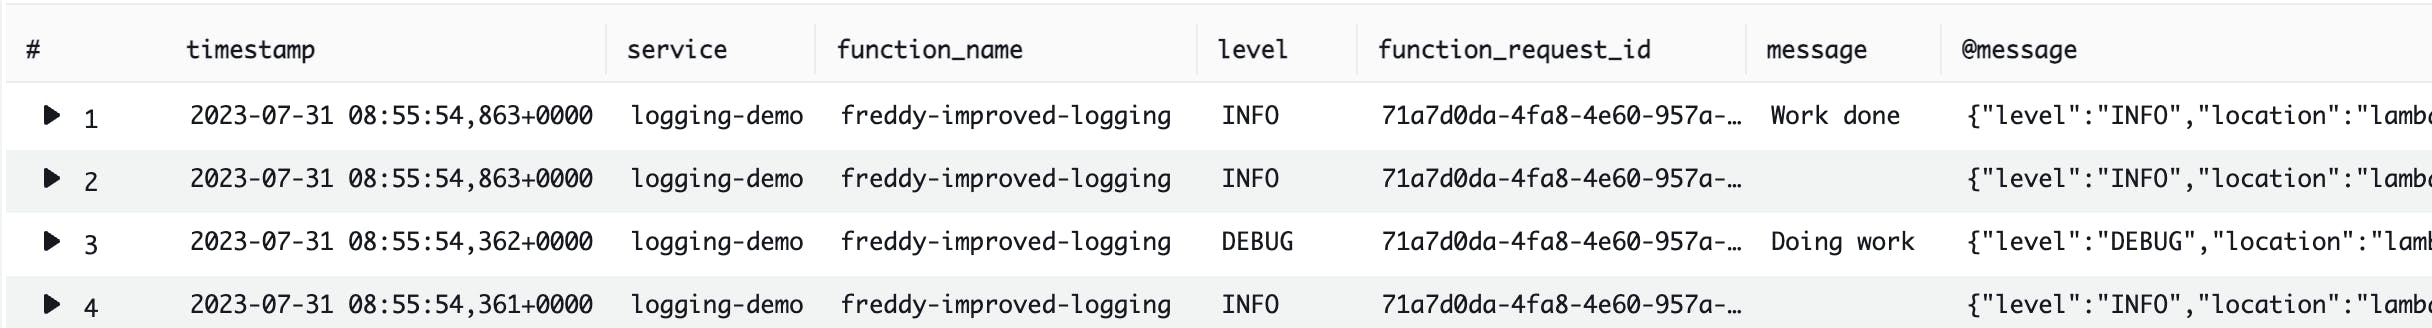
The below query contains all the common standard fields provided by AWS Lambda Powertools Logger with captured Lambda context info as columns. However, using so many columns may be unnecessary.
display @timestamp, timestamp, service, function_name, function_arn, level, xray_trace_id, function_request_id, cold_start, function_memory_size, message, @message
| sort timestamp desc
Filter logs with a substring in the message field
The below query does a cases sensitive search for the substring "work" in the message field:
display @timestamp, timestamp, service, level, xray_trace_id, location, message, @message
| filter message like "work"
| sort timestamp desc
An example query result is shown below:
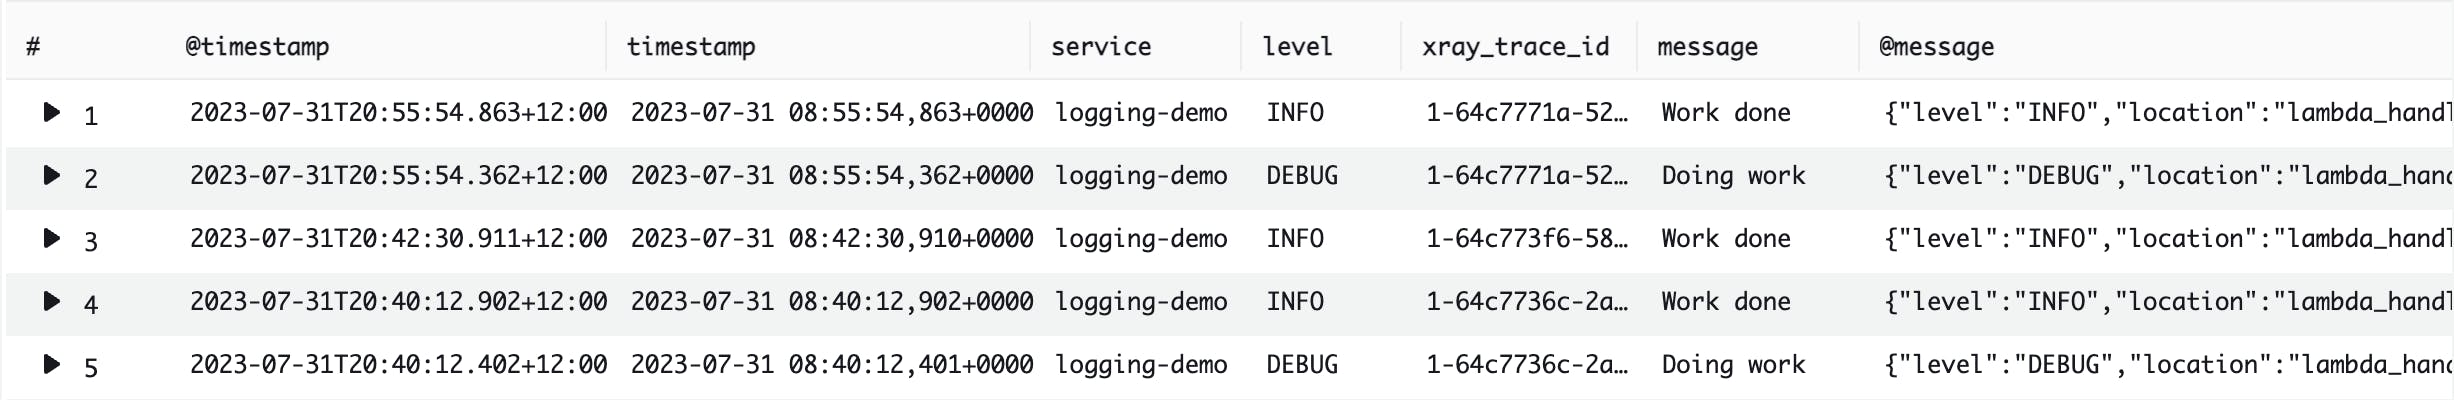
The below query does a case-insensitive search for the substring "work" in the message field:
display @timestamp, timestamp, service, level, xray_trace_id, message, @message
| filter message like /(?i)work/
| sort timestamp desc
An example query result is shown below:
Filter logs of specified severity levels
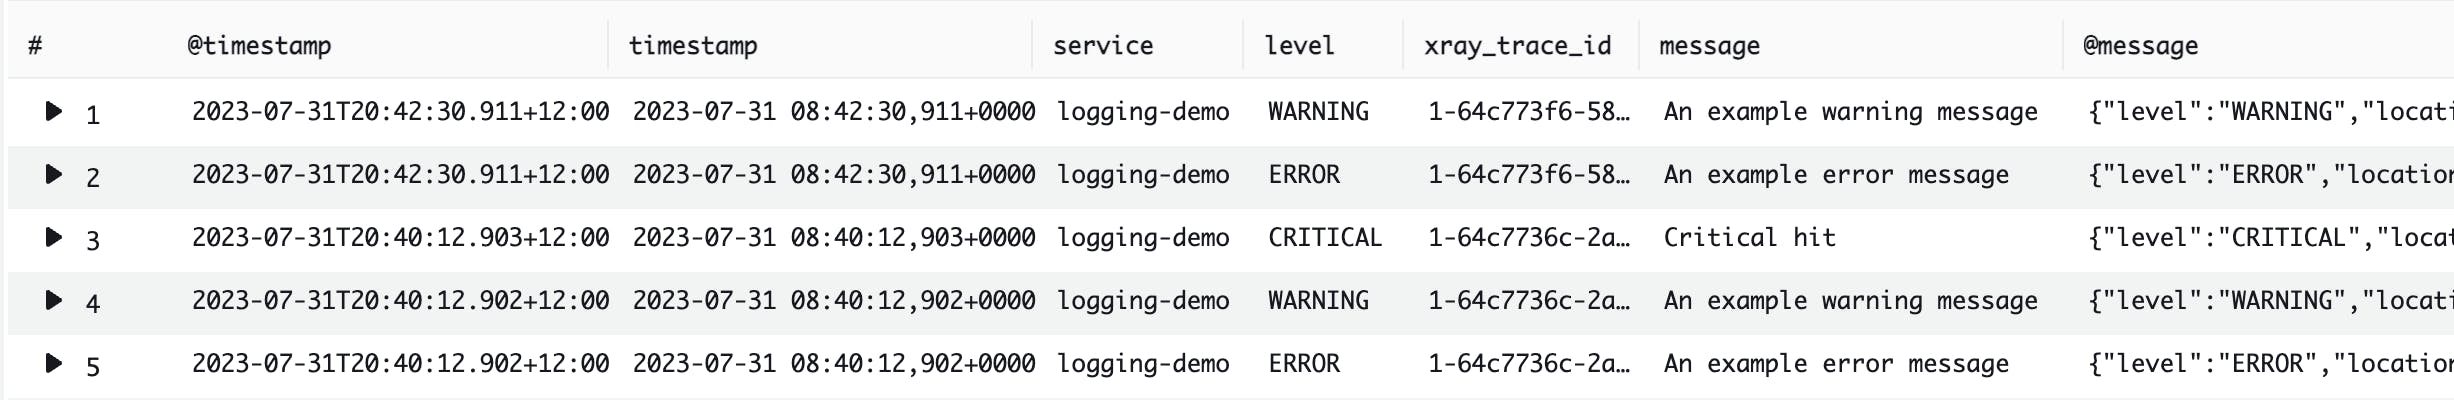
The below query does a search of logs with log severity levels of "WARNING", "ERROR" and "CRITICAL":
display @timestamp, timestamp, service, level, xray_trace_id, message, @message
| filter level in ["WARNING", "ERROR", "CRITICAL"]
| sort @timestamp desc
An example query result is shown below:
Show the number of log events for each severity level
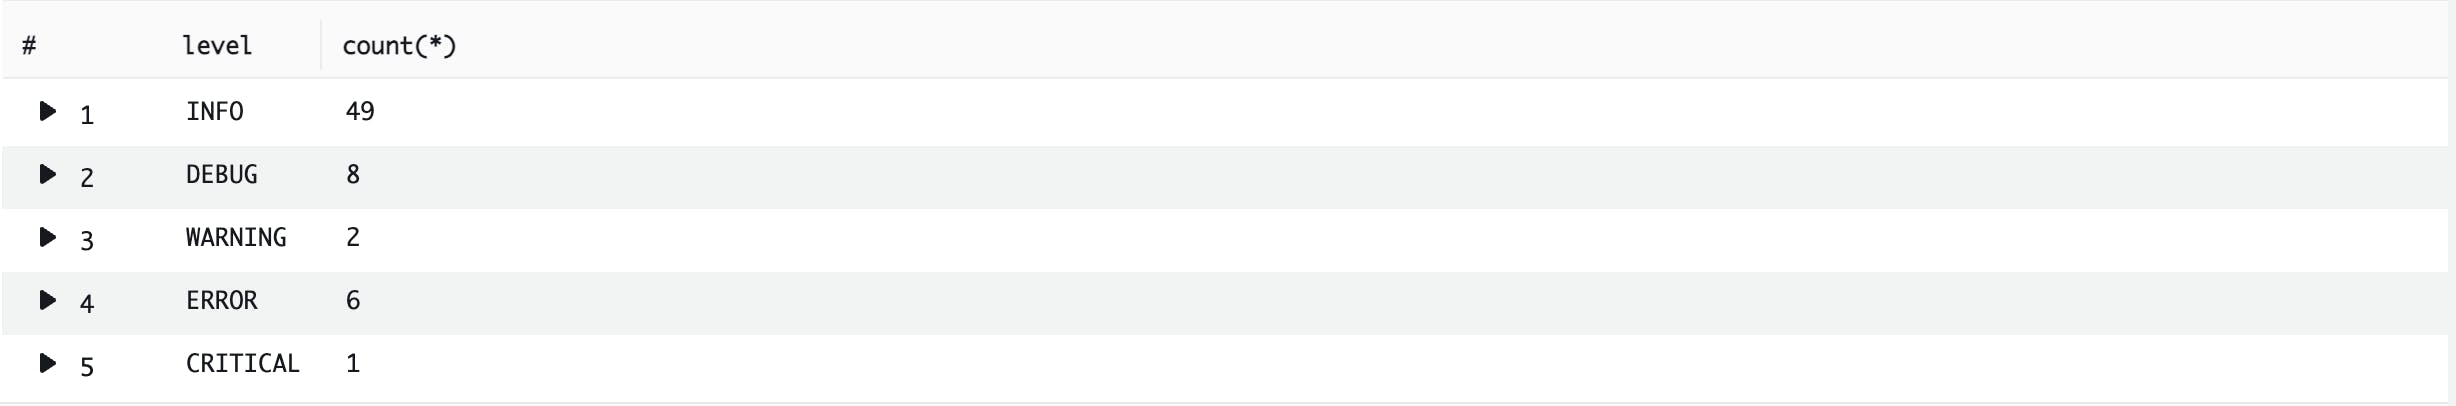
The below query shows the number of log events for each log severity level. This will also filter out any log events which do not contain the level field:
stats count(*) by level
| filter ispresent(level)
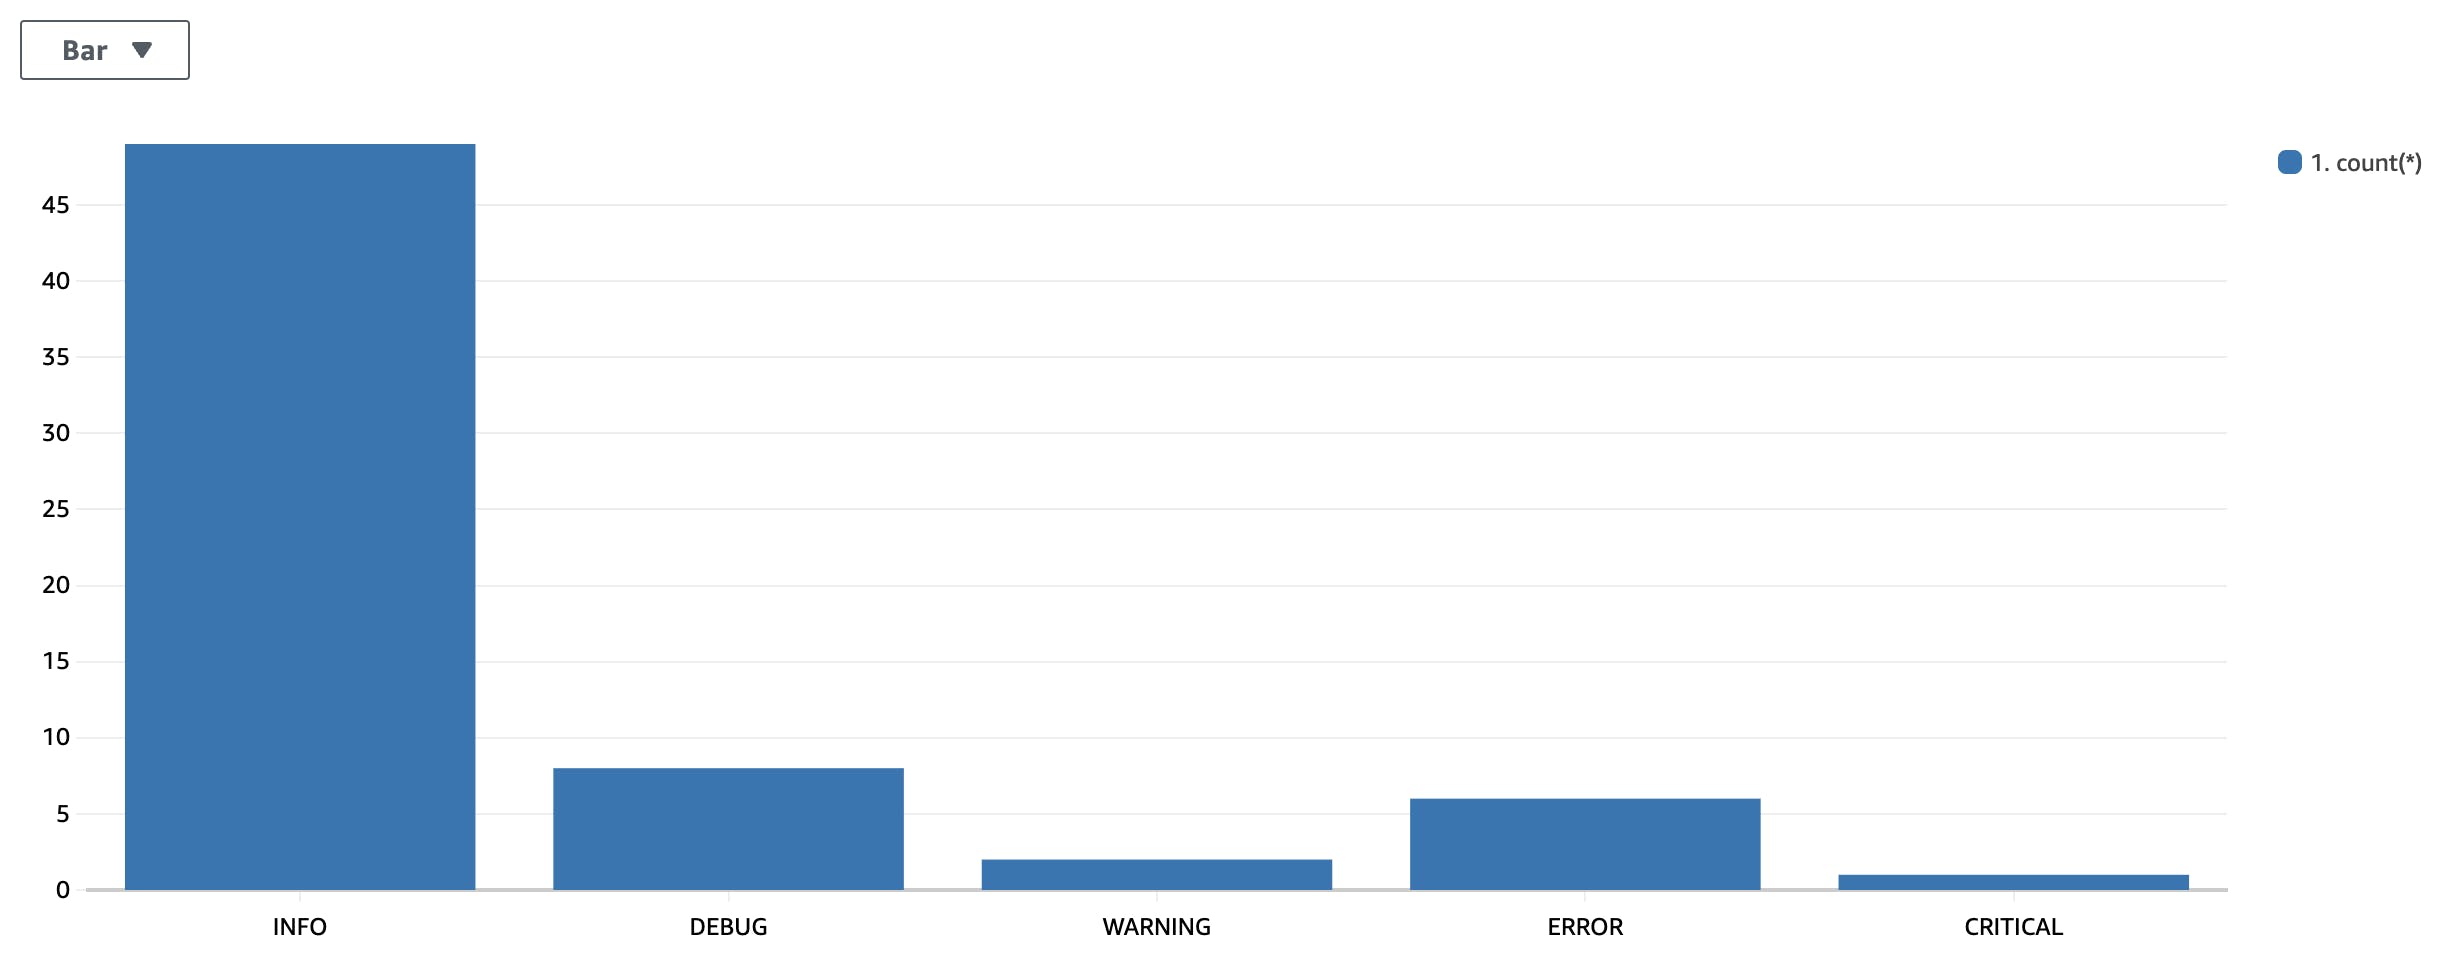
An example query result is shown below:
This can also be viewed as a bar graph (by choosing Visualization) as shown below:
Show the number of logs of a specified severity level, grouped into time intervals
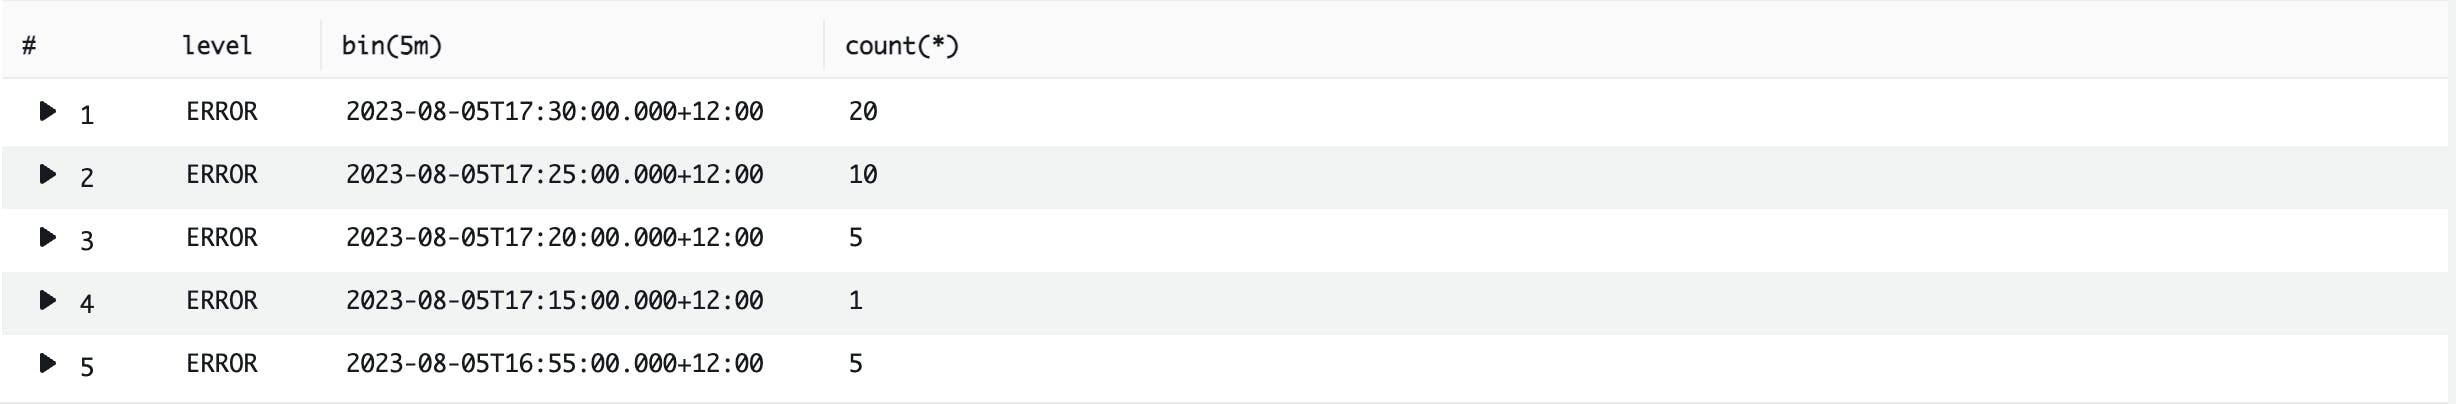
The below query shows the number of "ERROR" severity level log events grouped into 5 minute intervals:
stats count(*) by level, bin(5m)
| filter level = "ERROR"
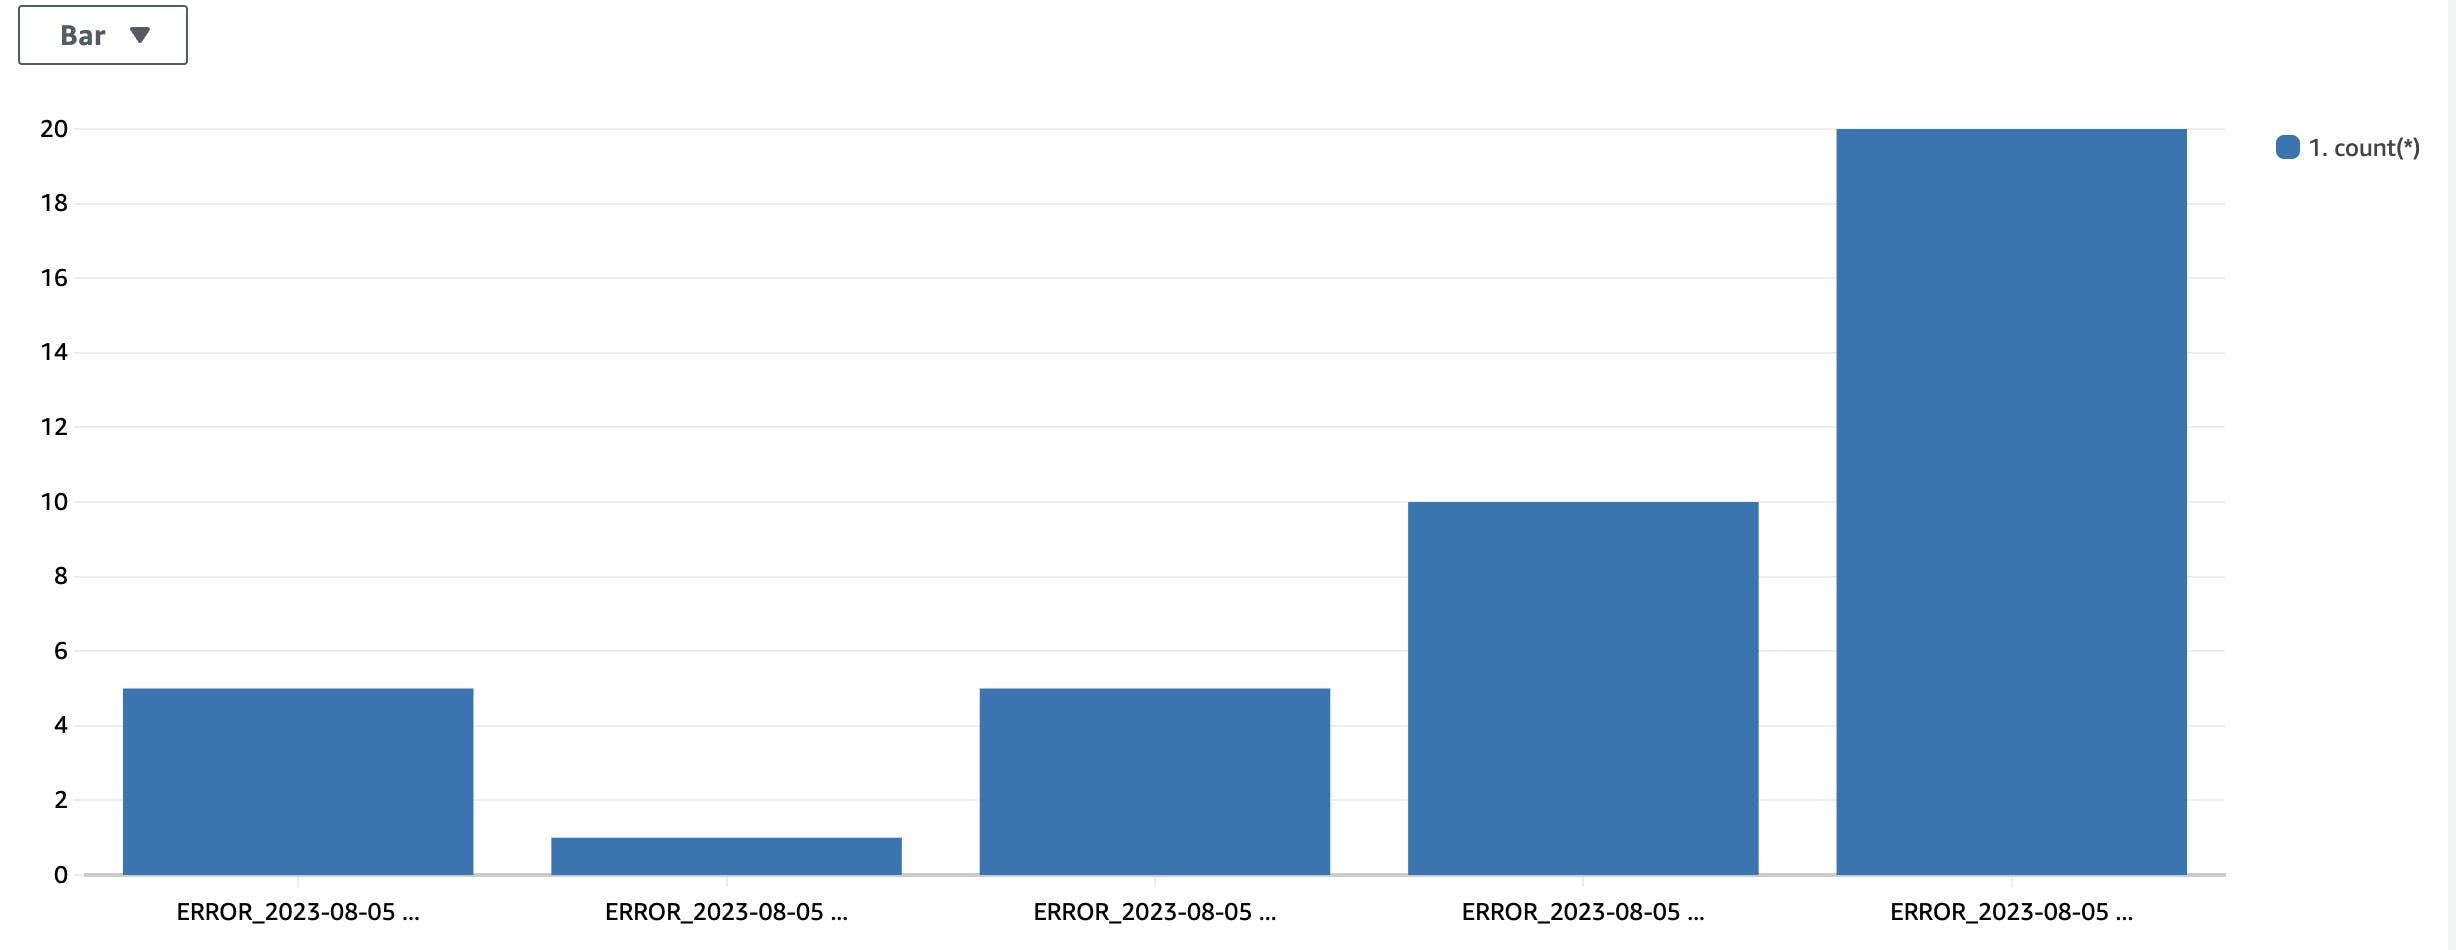
An example query result is shown below:
This can also be viewed as a bar graph (by choosing Visualization) as shown below:
Some other examples of grouping interval times using the bin() function are below:
bin(5s)- 5 secondsbin(1h)- 1 hourbin(1d)- 1 daybin(1w)- 1 week
Filter logs by a specified service across multiple Lambda functions
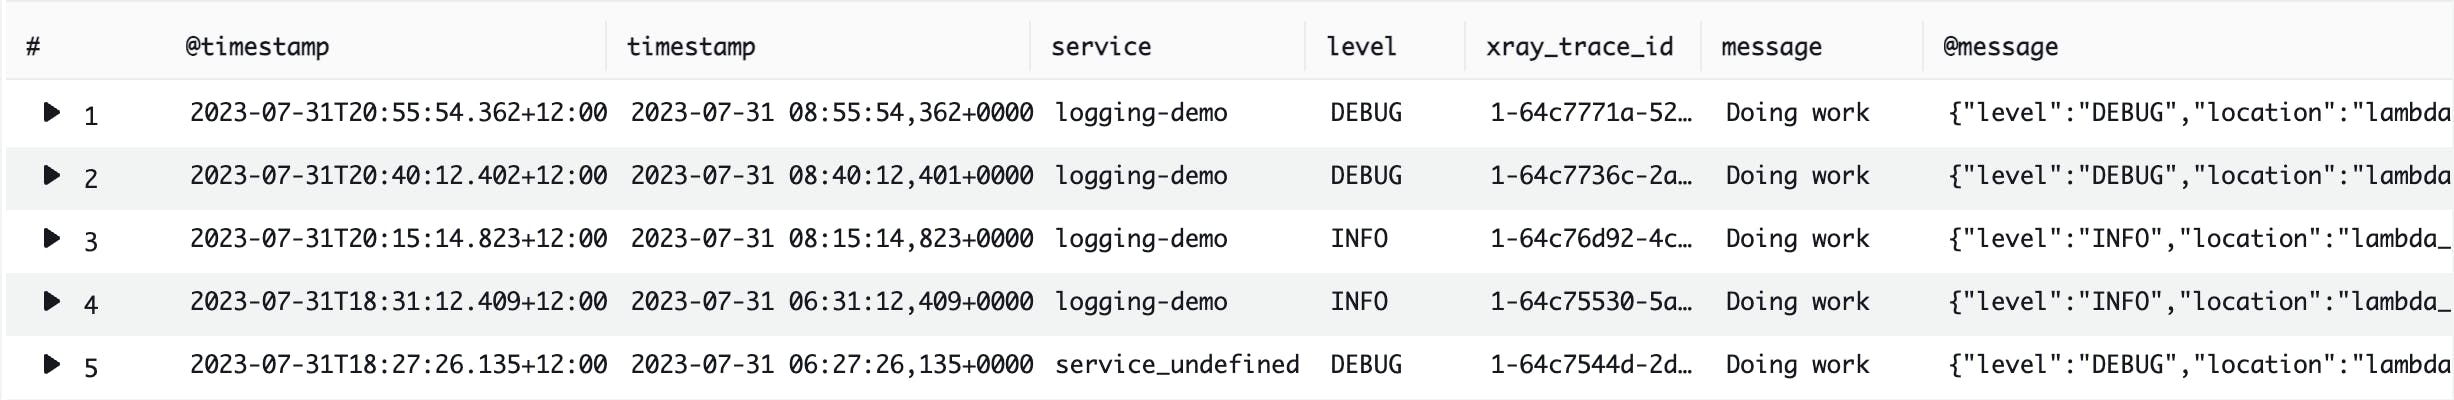
The below query searches for log events where the service field is "logging-demo". This is useful for querying multiple Lambda function log groups that are all part of the same service. Note that this query uses fields provided by AWS Lambda Powertools Logger, configured to capture the Lambda context info.
display @timestamp, timestamp, service, level, function_name, function_request_id, message, @message
| filter service = "logging-demo"
| sort @timestamp desc
An example query result is shown below:
Filter logs of the Lambda invoke event
The below query searches for log events containing the Lambda invocation event object.
This requires the Lambda Powertools Logger to be configured to capture the invoke event by providing the following decorator above the Lambda handler function.
@logger.inject_lambda_context(log_event=True)
def lambda_handler(event, context):
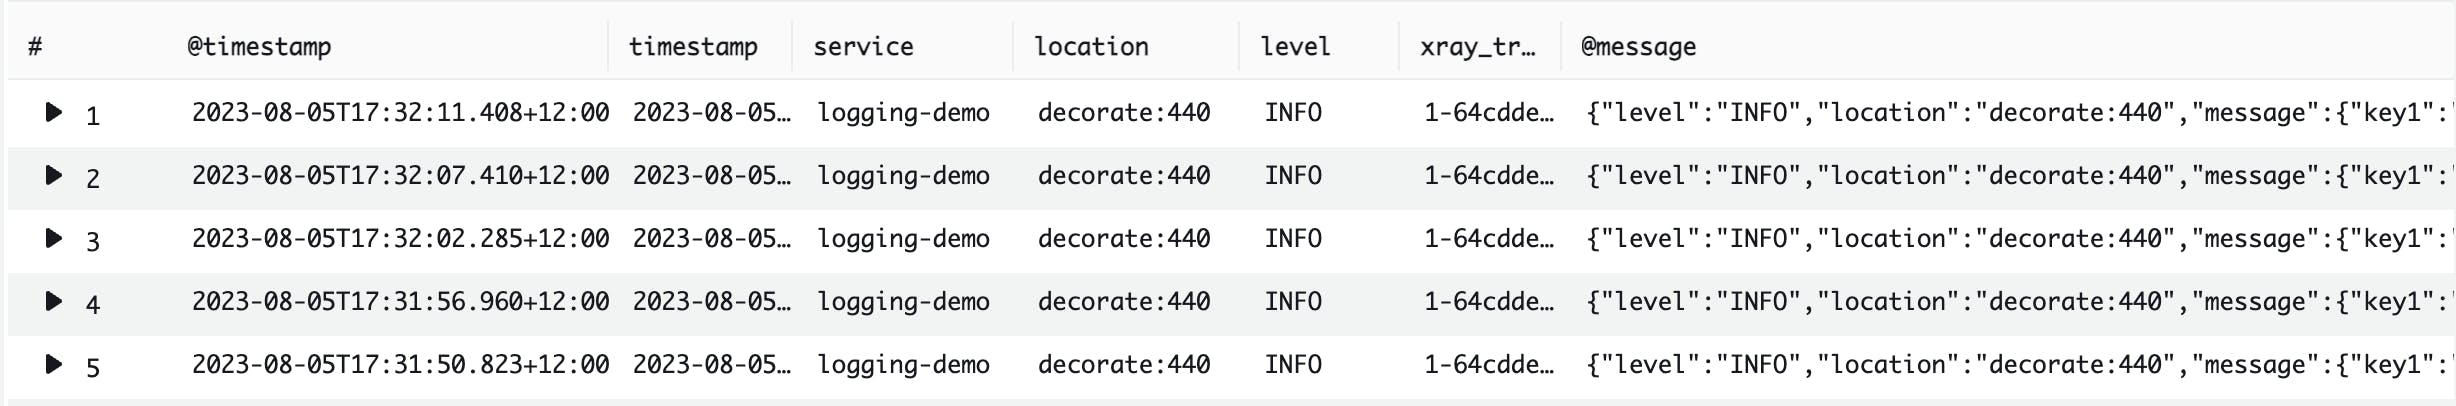
The query assumes that the Lambda invoke object occurs where the code line location field has the word "decorate".
display @timestamp, timestamp, service, location, level, xray_trace_id, @message, message
| filter location like "decorate"
| sort timestamp desc
An example query result is shown below:
Filter logs with message object fields
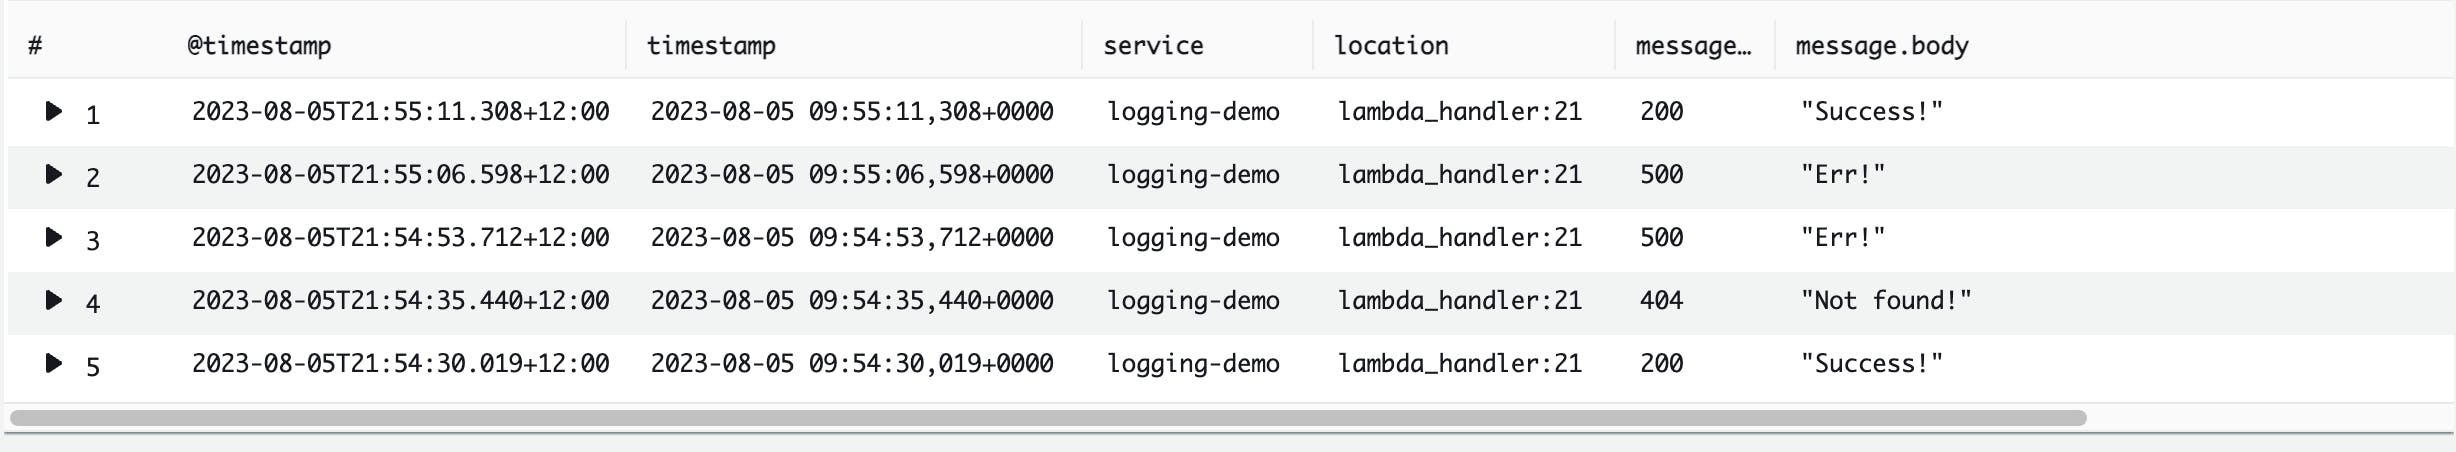
The below query searches for only log events with the message object fields message.statusCode and message.body. These fields are then used as columns:
display @timestamp, timestamp, service, location, message.statusCode, message.body
| filter ispresent(message.statusCode)
| sort @timestamp desc
An example query result is shown below:
The below query searches for log events with the message object fields message.statusCode is "200".
display @timestamp, timestamp, service, location, message.statusCode, message.body
| filter message.statusCode = "200"
| sort @timestamp desc
An example query result is shown below:

Save your queries
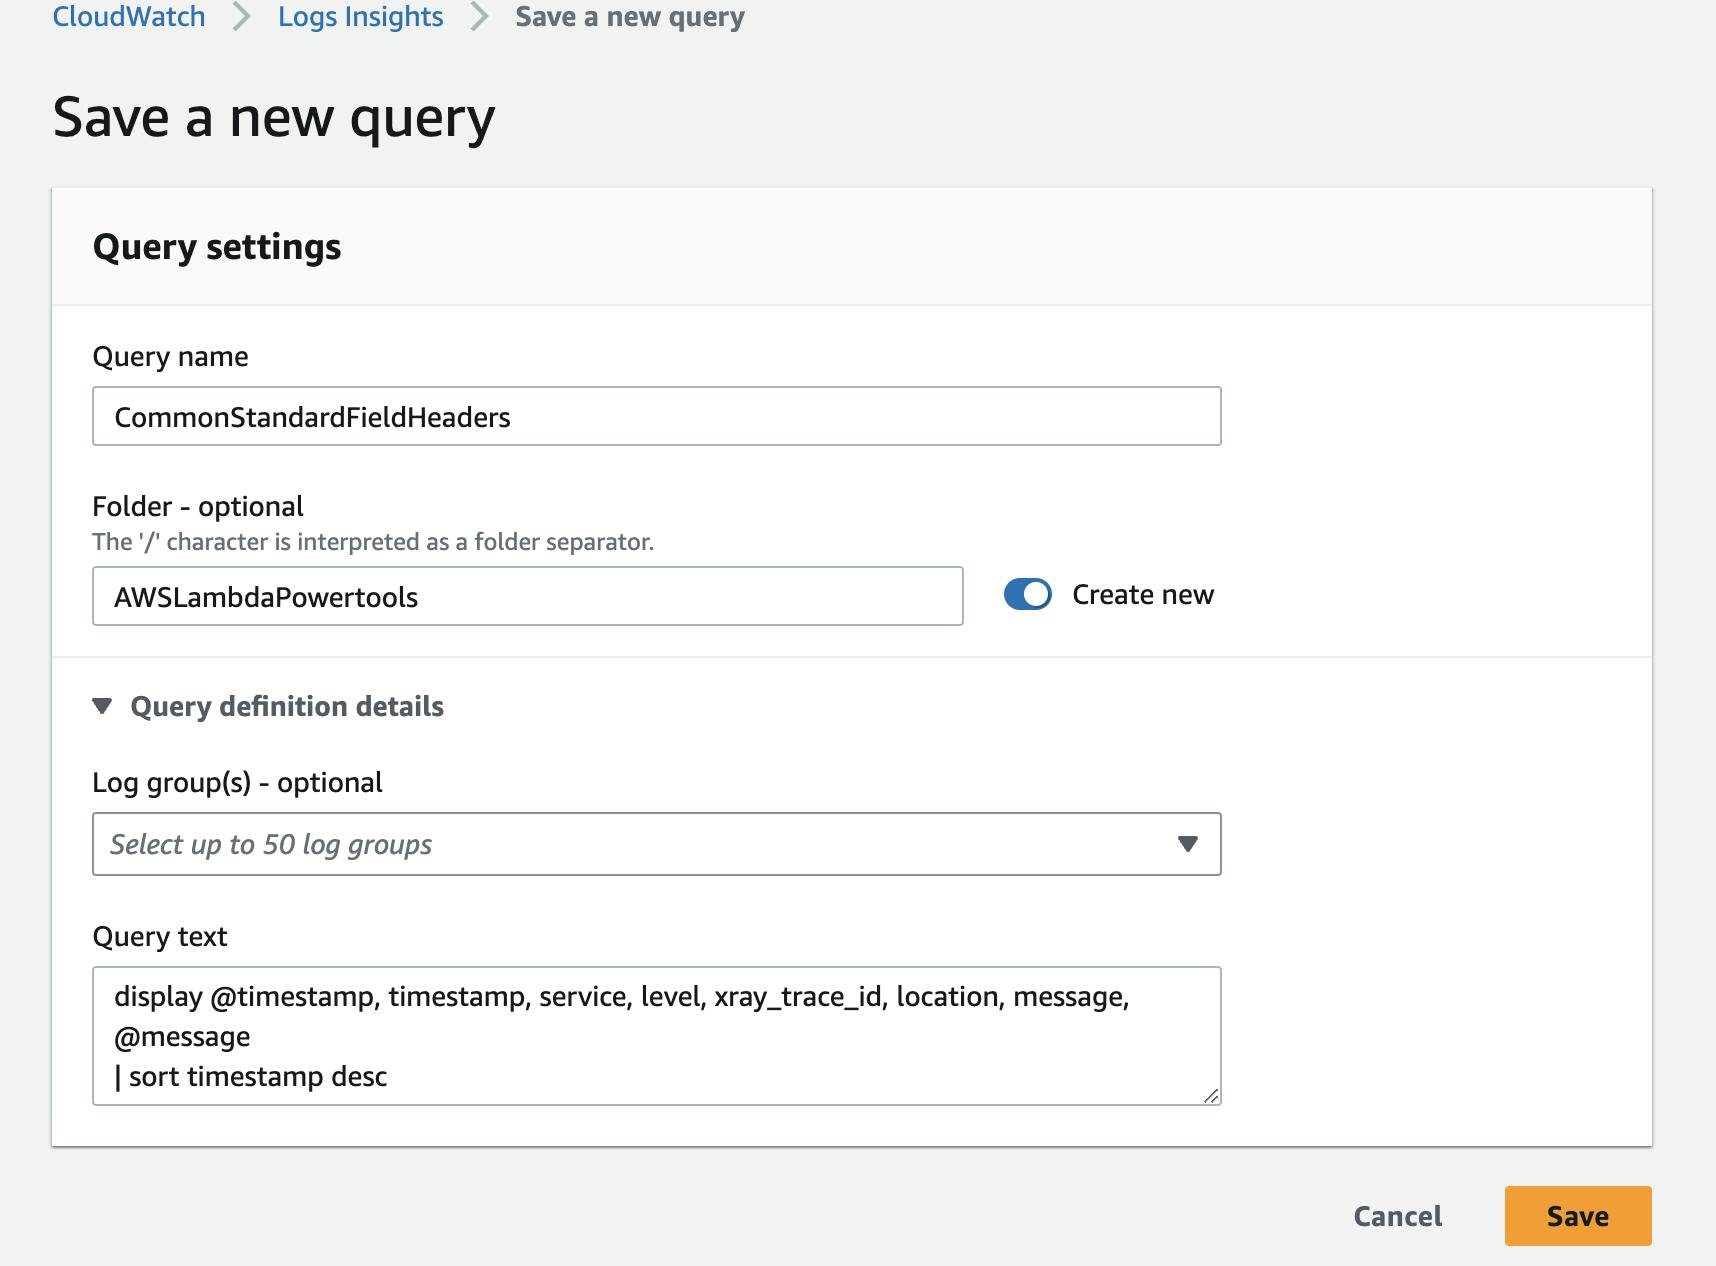
With the ability to form many different CloudWatch Log Insights queries, it is worth pointing out that you can save your queries for later use. You can do this by choosing the Save button.
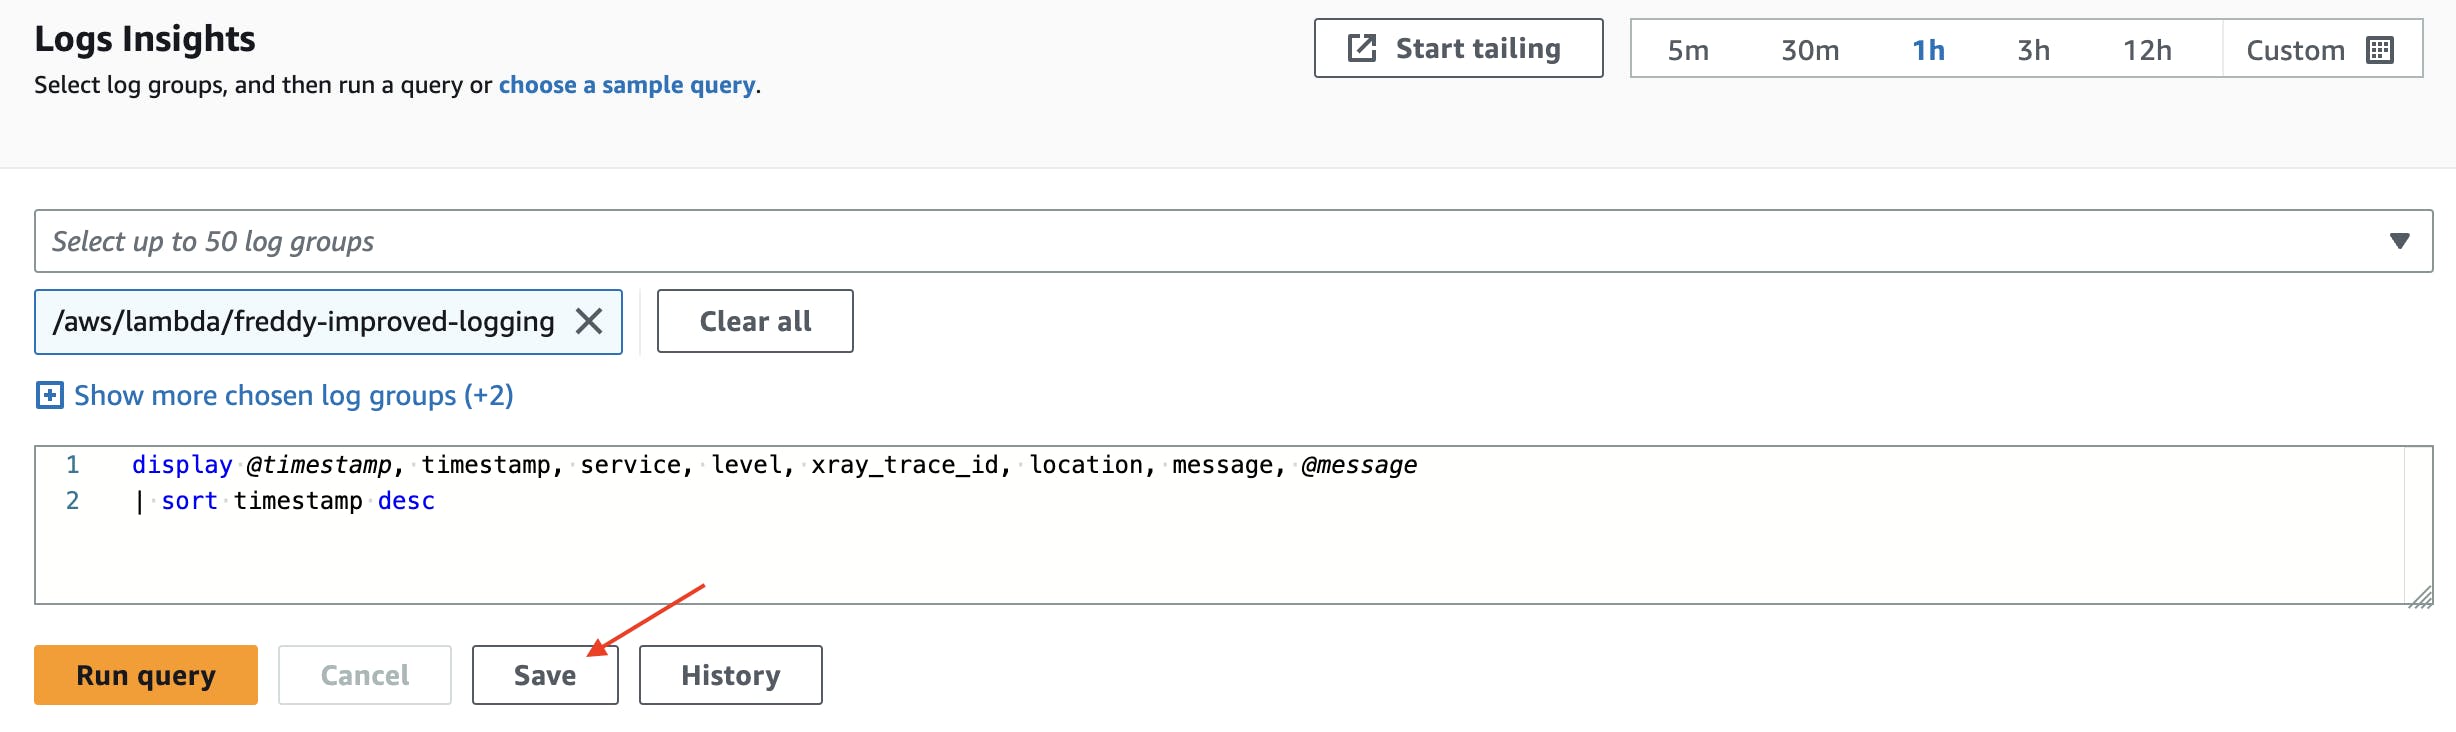
You can provide a Query name and an optional Folder name when saving your query. Choose Save to save your query. An example query to save is below:
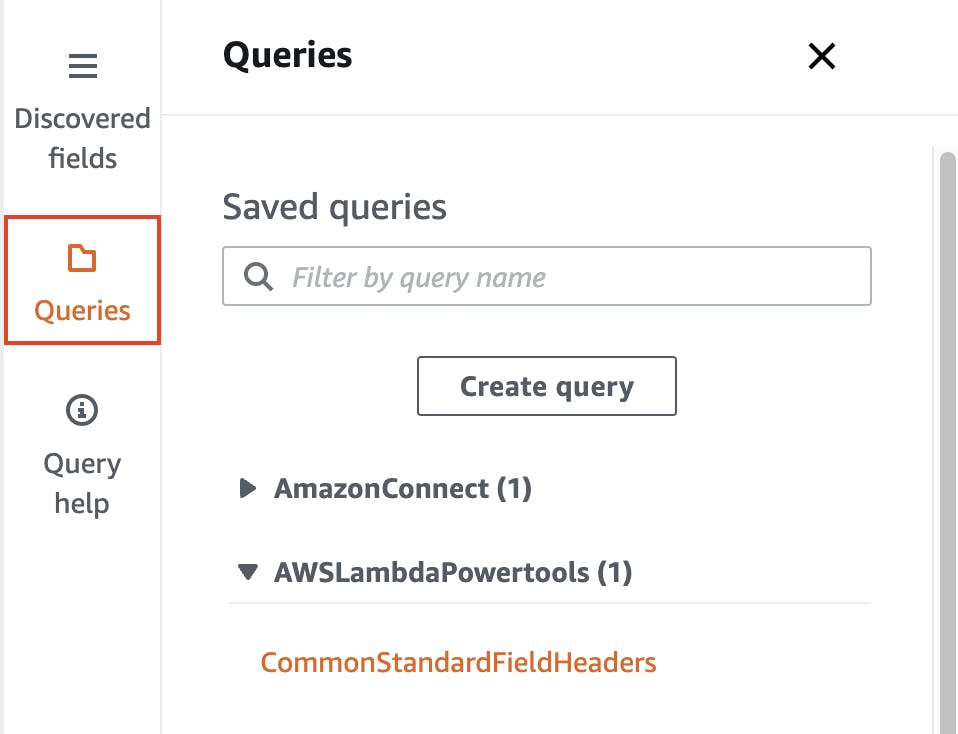
You can load your saved queries by choosing Queries on the right-hand side. Unde Saved queries, choose your saved query.
Conclusion
When it comes to the ability to analyse and troubleshoot your AWS Lambda services, using CloudWatch Log Insights with AWS Lambda Powertools Logger is an effective combination. AWS Lambda Powertools Logger provides a utility for your Lambda functions to produce logs in JSON format and with common standard fields. These features can then be taken advantage of by CloudWatch Log Insights to effectively query an analyse your Lambda function logs.
This blog post provides a handful of queries that can be used in CloudWatch Log Insights to query you AWS Lambda function logs using AWS Lambda Powertools Logger. For more information on CloudWatch Log Insights query syntax, see https://docs.aws.amazon.com/AmazonCloudWatch/latest/logs/CWL_QuerySyntax.html.