Better logging in AWS Lambda for Python newbies
Using the AWS Lambda Powertools Logger


Introduction
AWS Lambda is an amazing serverless service that enables you to execute your code without the hassle of managing any servers. However, even for seasoned coders, getting your Lambda function code to work flawlessly on the first try is often a challenge. Moreover, it's not uncommon to encounter faults and errors once your Lambda function is live. Luckily, AWS Lambda seamlessly integrates with CloudWatch Logs. By making a simple "print" call (in Python), you can log messages to CloudWatch Logs, providing useful troubleshooting insights to resolve any issues that may arise later on.
Your ability to troubleshoot and resolve issues in your Lambda function largely depends on the quality of logging. To assist you with this, I'd like to introduce a beginner-friendly, quick, and easy way to enhance your logging in Python AWS Lambda functions using AWS Lambda Powertools.
What is AWS Lambda Powertools?
AWS Lambda Powertools is a developer toolkit to implement Serverless best practices and increase developer velocity.
In this post, I will only cover a portion of its logging features, however, it has a lot of other useful features for AWS Lambda development that I would recommend exploring in your own time here: https://docs.powertools.aws.dev/lambda/python/latest/
AWS Lambda Powertools is also available for TypeScript, Java, and C# .NET, and its logging features for these runtimes are similar to the Python-based approach I'll be illustrating in this post.
Starting point - logging with print
Below is a simple example Lambda function code which uses the built-in Python print() function to print out messages. Besides this, this code does nothing but waits for half and second then returns a hard-coded response. Nevertheless, this code can be used to demonstrate how we can improve the logging quality.
import json
import time

def lambda_handler(event, context):
    print(event)

    # Do work here
    print("Doing work")
    time.sleep(0.5)
    print("Work done")

    response = {
        'statusCode': 200,
        'body': json.dumps('Hello from Lambda!')
    }
    print(response)

    return response
When the Lambda function is run, the printed-out messages are sent to CloudWatch Logs as shown below:
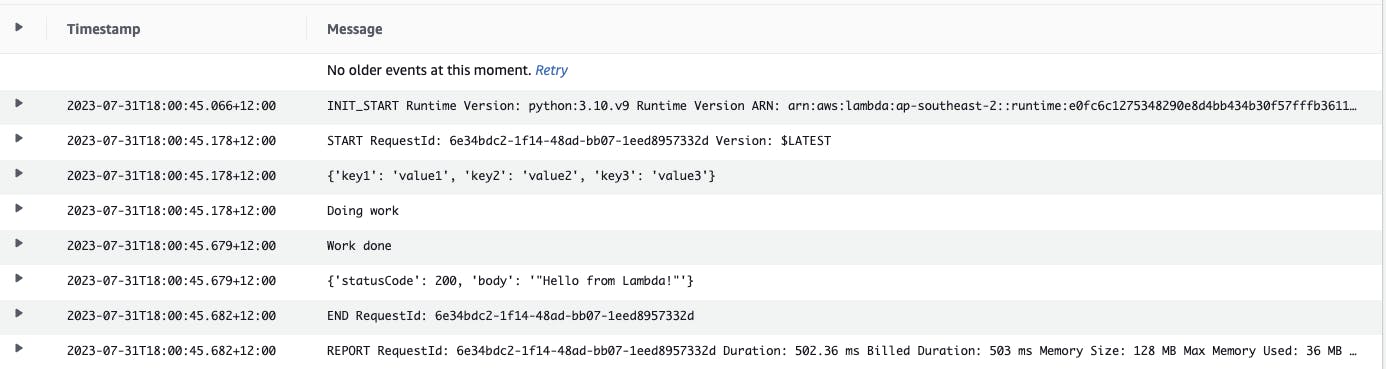
In the logs we can see the following:
Lambda Invoke event object
Messages signifying starting and finishing "work"
The Lambda output response object
This acts as our starting point to improve the logging.
Using the AWS Lambda Powertools Logger
We will now introduce the AWS Lambda Powertools Logger object to our code which will drastically improve our logging quality.
First, we need to have the AWS Lambda Powertools Python package available for our Lambda function to use. This can be conveniently done by configuring our Lambda function to use the public AWS Lambda Powertools Lambda Layer.
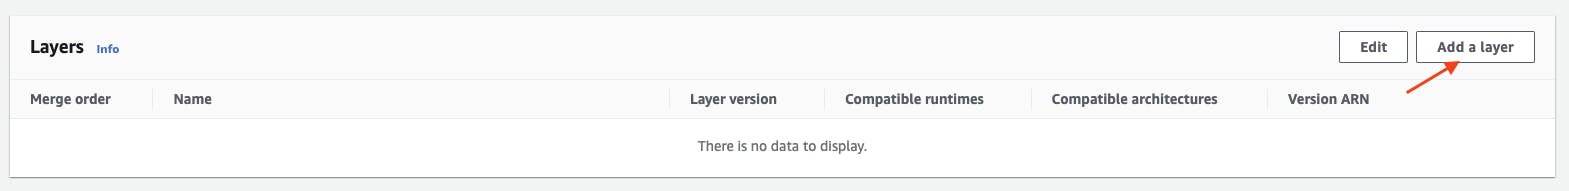
To do this in the AWS Console, in your Lambda Function under the Code tab, under Layers, choose Add a Layer.
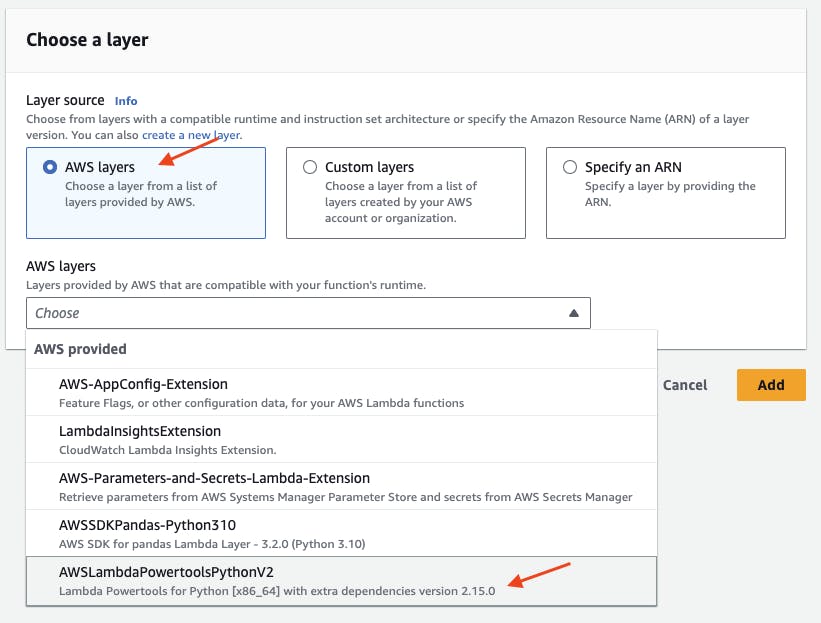
Under Choose a Layer, select AWS layers, then from the drop-down, select AWSLambdaPowertoolsPythonV2, then choose Add.
Now we can import and instantiate AWS Lambda Powertools Logger object by adding the following to our starting code, below our existing "import" statements:
import json
import time

from aws_lambda_powertools import Logger

logger = Logger(service="logging-demo")
Next, we can replace all our print() functions with the logger.info() function, using the same message argument.
The code should now look like this:
import json
import time

from aws_lambda_powertools import Logger

logger = Logger(service="logging-demo")

def lambda_handler(event, context):
    logger.info(event)

    # Do work here
    logger.info("Doing work")
    time.sleep(0.5)
    logger.info("Work done")

    response = {
        'statusCode': 200,
        'body': json.dumps('Hello from Lambda!')
    }
    logger.info(response)

    return response
After running the updated Lambda function, the logs now look like this in CloudWatch:
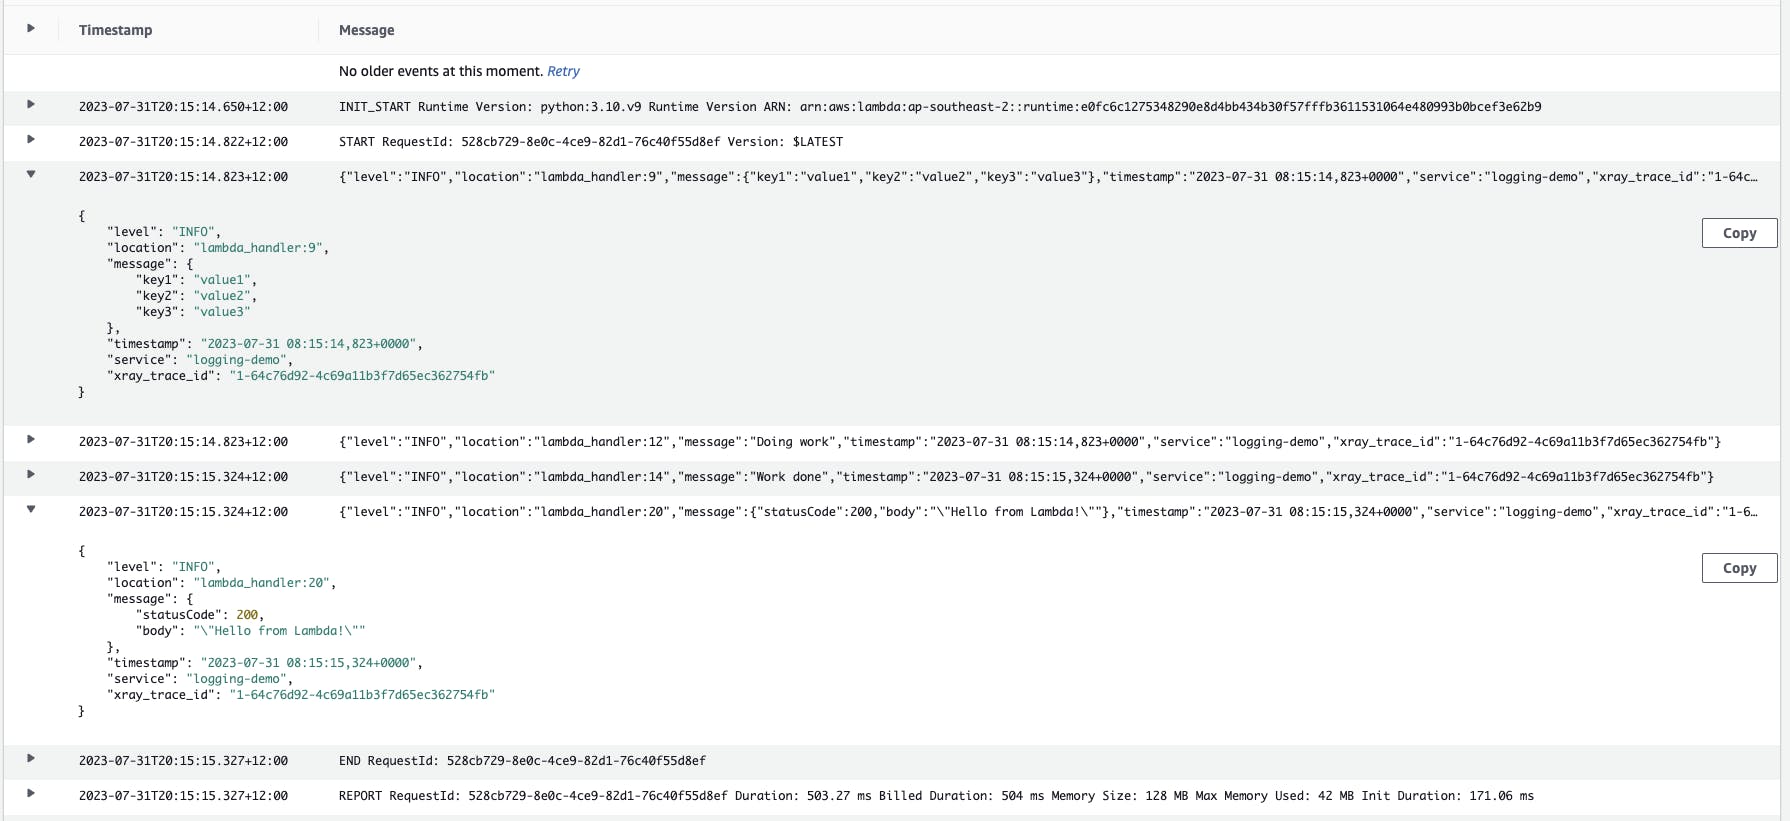
A major difference seen is that the logs are now in JSON format. JSON format is more easily parsable by log analysis tools, allowing to search fields with the JSON key.
Other log improvements we can see are the timestamp and location fields. The location field contains the function name and the line number where the logging message occurred.
The service field contains "logging-example" which we set when instantiating the logger object. This field can be used to search for a particular service amongst aggregated logs of several services.
Using log severity levels
So far our code has logged all our messages at the "INFO" severity level. We also have the option of logging at the following severity levels (in descending severity order):
CRITICAL
ERROR
WARNING
INFO
DEBUG
Our code has been updated below to demonstrate the use of different log severity levels.
import json
import time

from aws_lambda_powertools import Logger

logger = Logger(service="logging-demo")

def lambda_handler(event, context):
    logger.info(event)

    # Do work here
    logger.debug("Doing work")
    time.sleep(0.5)
    logger.info("Work done")
    logger.warning("An example warning message")
    logger.error("An example error message")

    response = {
        'statusCode': 200,
        'body': json.dumps('Hello from Lambda!')
    }
    logger.info(response)

    return response
After running the updated Lambda function, the logs now look like this in CloudWatch:
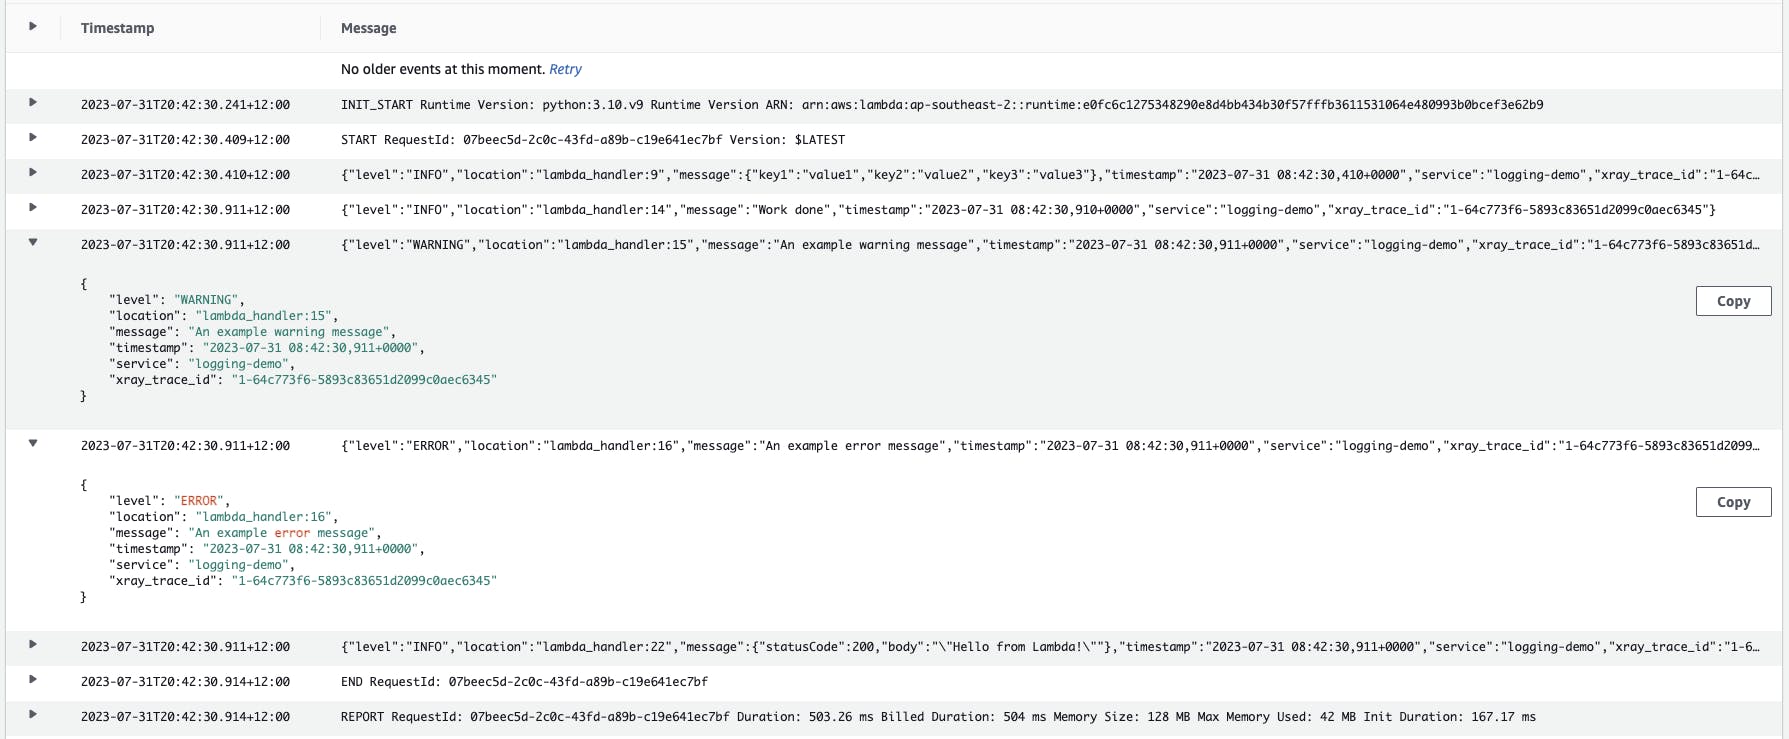
You can see that the logs do not contain the message for logger.debug("Doing work"). This is because, by default, the logger will only log "INFO" severity or higher. You can change this by setting the Lambda function with the environment variable, LOG_LEVEL.
Setting LOG_LEVEL to DEBUG will cause all log severity messages to be displayed.
Setting LOG_LEVEL to WARNING will cause "WARNING" and higher severity messages ("ERROR" and "CRITICAL") to be displayed.
Make use of the LOG_LEVEL environment variable to control the verbosity of your logs.
Automatically log Lambda context
The AWS Lambda Powertools can automatically log fields from the Lambda context object. This can be easily achieved by adding the following decorator code line just above the lambda handler function definition:
@logger.inject_lambda_context
After removing the "WARNING" and "ERROR" log messages and then adding the inject context decorator code line, our updated code should now look like below:
import json
import time

from aws_lambda_powertools import Logger

logger = Logger(service="logging-demo")

@logger.inject_lambda_context
def lambda_handler(event, context):
    logger.info(event)

    # Do work here
    logger.debug("Doing work")
    time.sleep(0.5)
    logger.info("Work done")

    response = {
        'statusCode': 200,
        'body': json.dumps('Hello from Lambda!')
    }
    logger.info(response)

    return response
After running the updated Lambda function, the logs now look like this in CloudWatch:
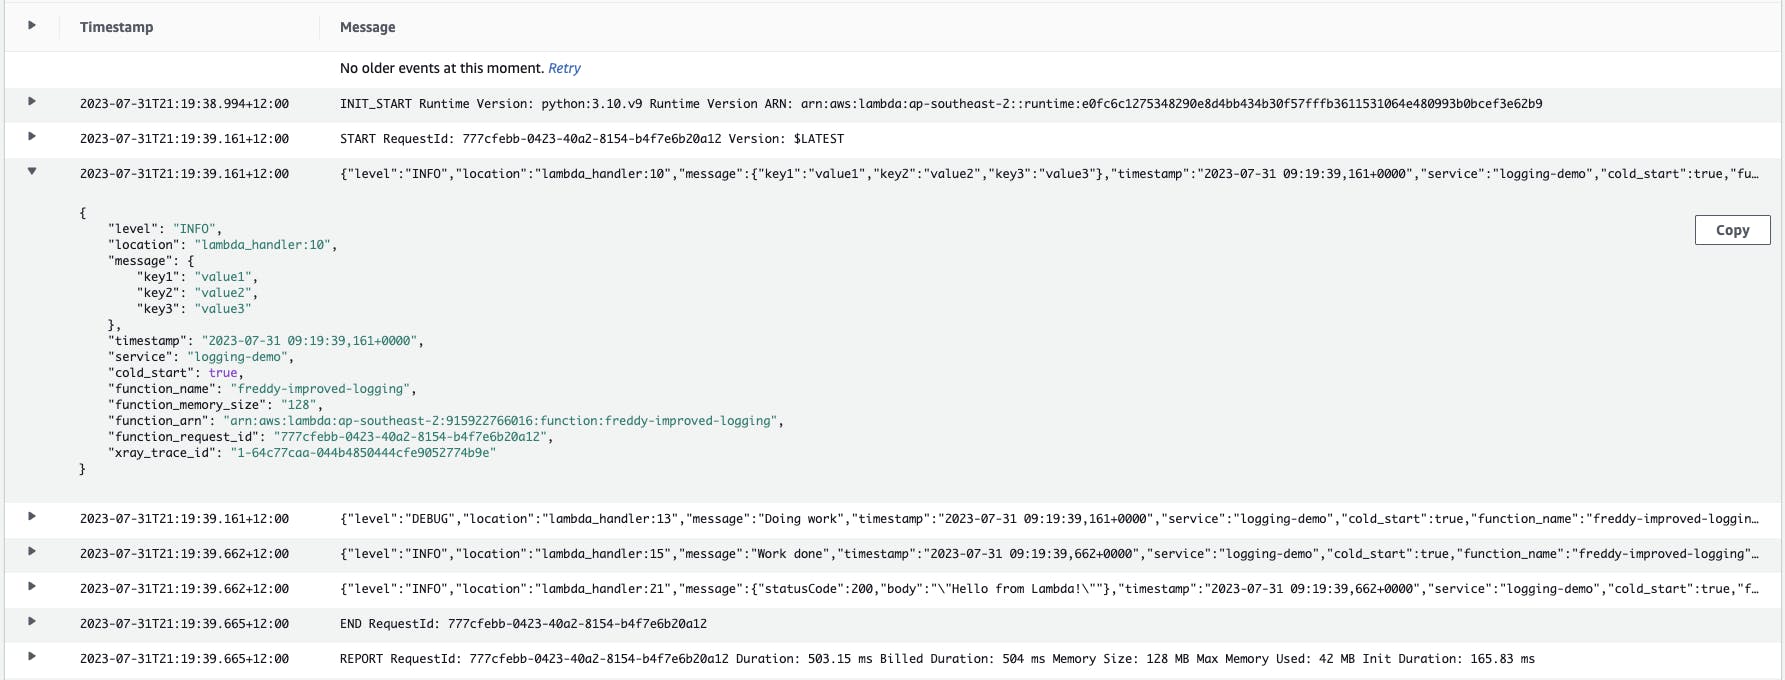
The logs now have additional fields provided by the context object. Some of these fields have been listed below with notes on how they could be useful.
cold_start- help troubleshoot performance issues with Lambda due to cold start latencyfunction_memory_size- help with performance tuningfunction_request_id- uniquely identify a single Lambda invocation event
Automatically log the invoke event object
The AWS Lambda Powertools can also automatically log the Lambda invoke event object using the following argument in the inject lambda context decorator like so:
@logger.inject_lambda_context(log_event=True)
We can thus remove the now redundant line logger.info(event), leaving our updated code to look like below:
import json
import time

from aws_lambda_powertools import Logger

logger = Logger(service="logging-demo")

@logger.inject_lambda_context(log_event=True)
def lambda_handler(event, context):

    # Do work here
    logger.debug("Doing work")
    time.sleep(0.5)
    logger.info("Work done")

    response = {
        'statusCode': 200,
        'body': json.dumps('Hello from Lambda!')
    }
    logger.info(response)

    return response
After running the updated Lambda function, the logs in CloudWatch show the invoke event object:

Conclusion
Below is a diff comparison of our starting code (left) and our code after implementing our logging improvements (right).
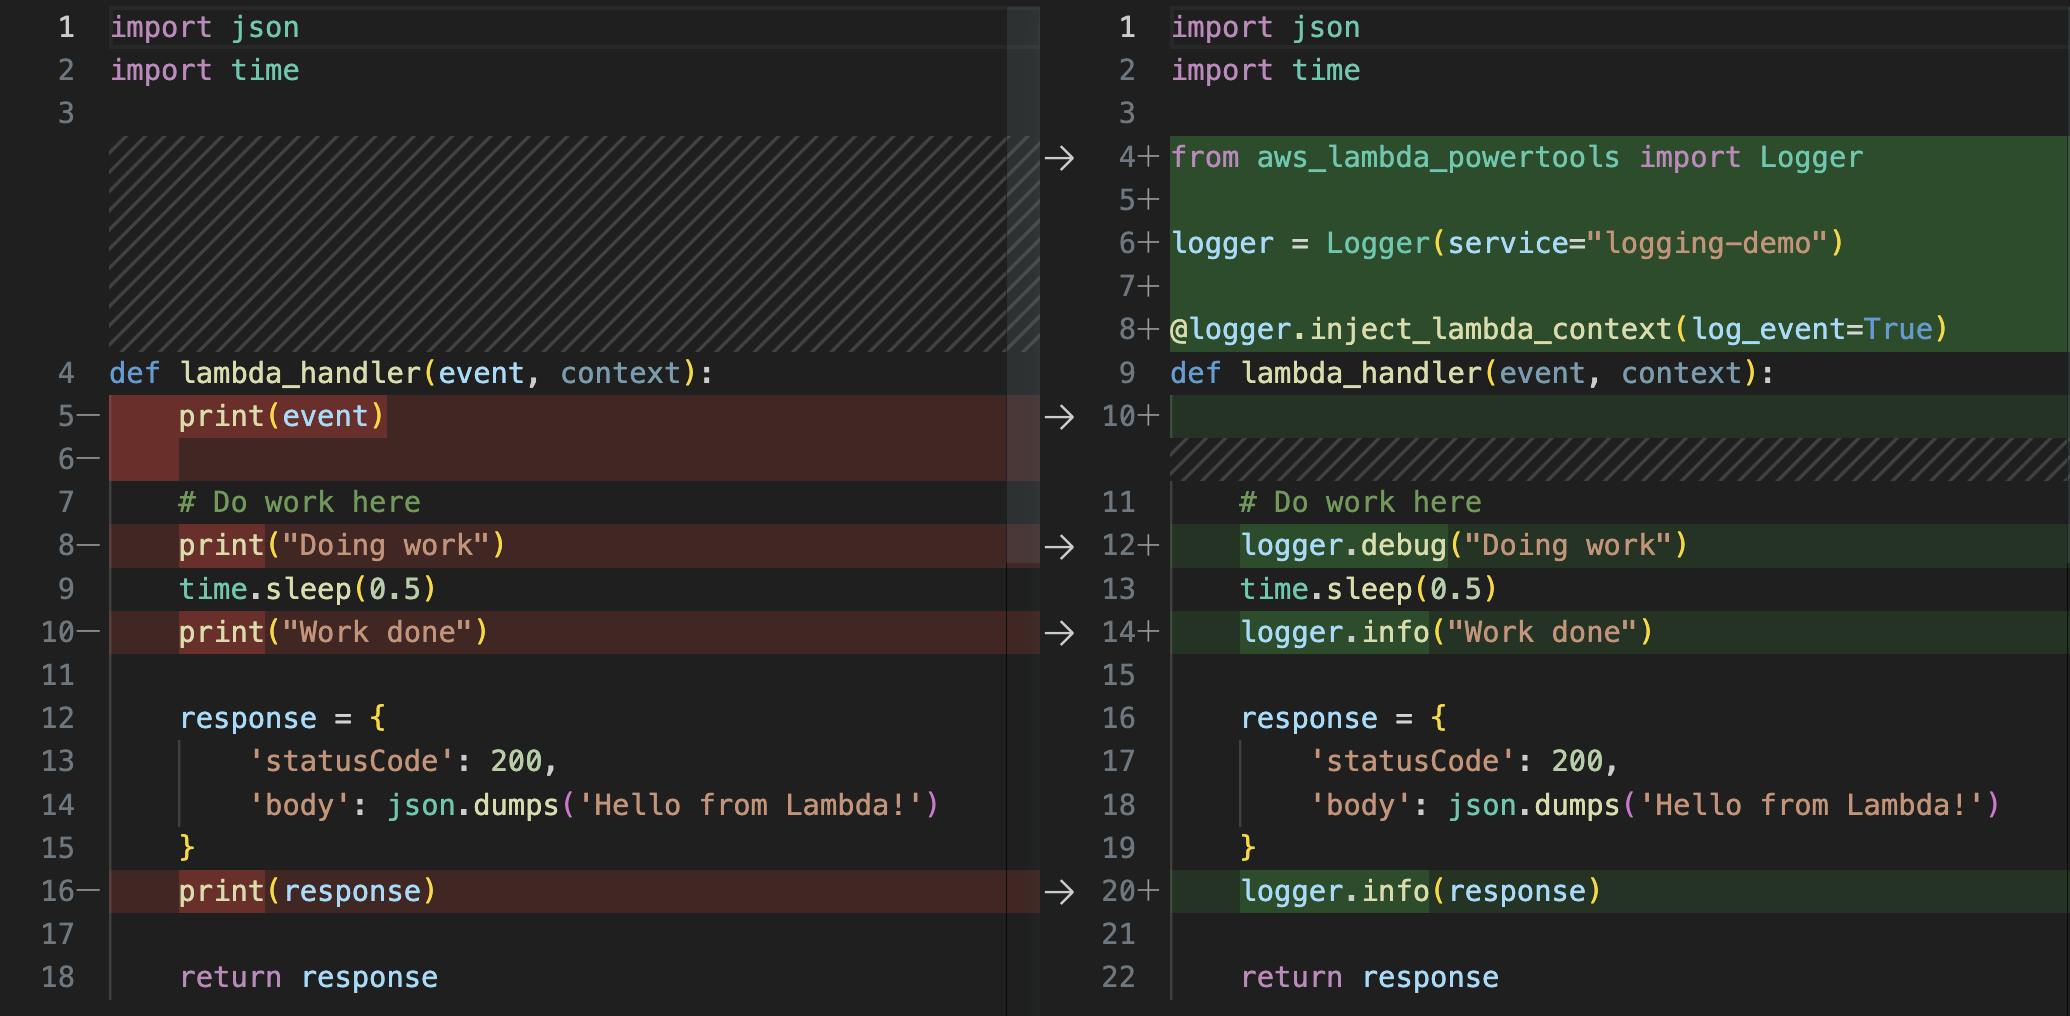
From this, we can see that it only requires a few small code changes to have a big improvement in logging quality. These improvements include:
Logging in JSON format.
Log severity levels with configurable verbosity.
Automatic logging of fields such as timestamp, code location, cold starts and more.
Automatic logging of the invoke event object.
The logging quality improvements were easily achieved by using the AWS Lambda Powertools Logger. The AWS Lambda Powertools Logger has several other useful features that we did not cover in this post. I highly recommend having a look at what these features are here: https://docs.powertools.aws.dev/lambda/python/latest/core/logger/